29
/
en
AIzaSyAYiBZKx7MnpbEhh9jyipgxe19OcubqV5w
April 1, 2024
251495
St. Lucia
LCA
true
2
1
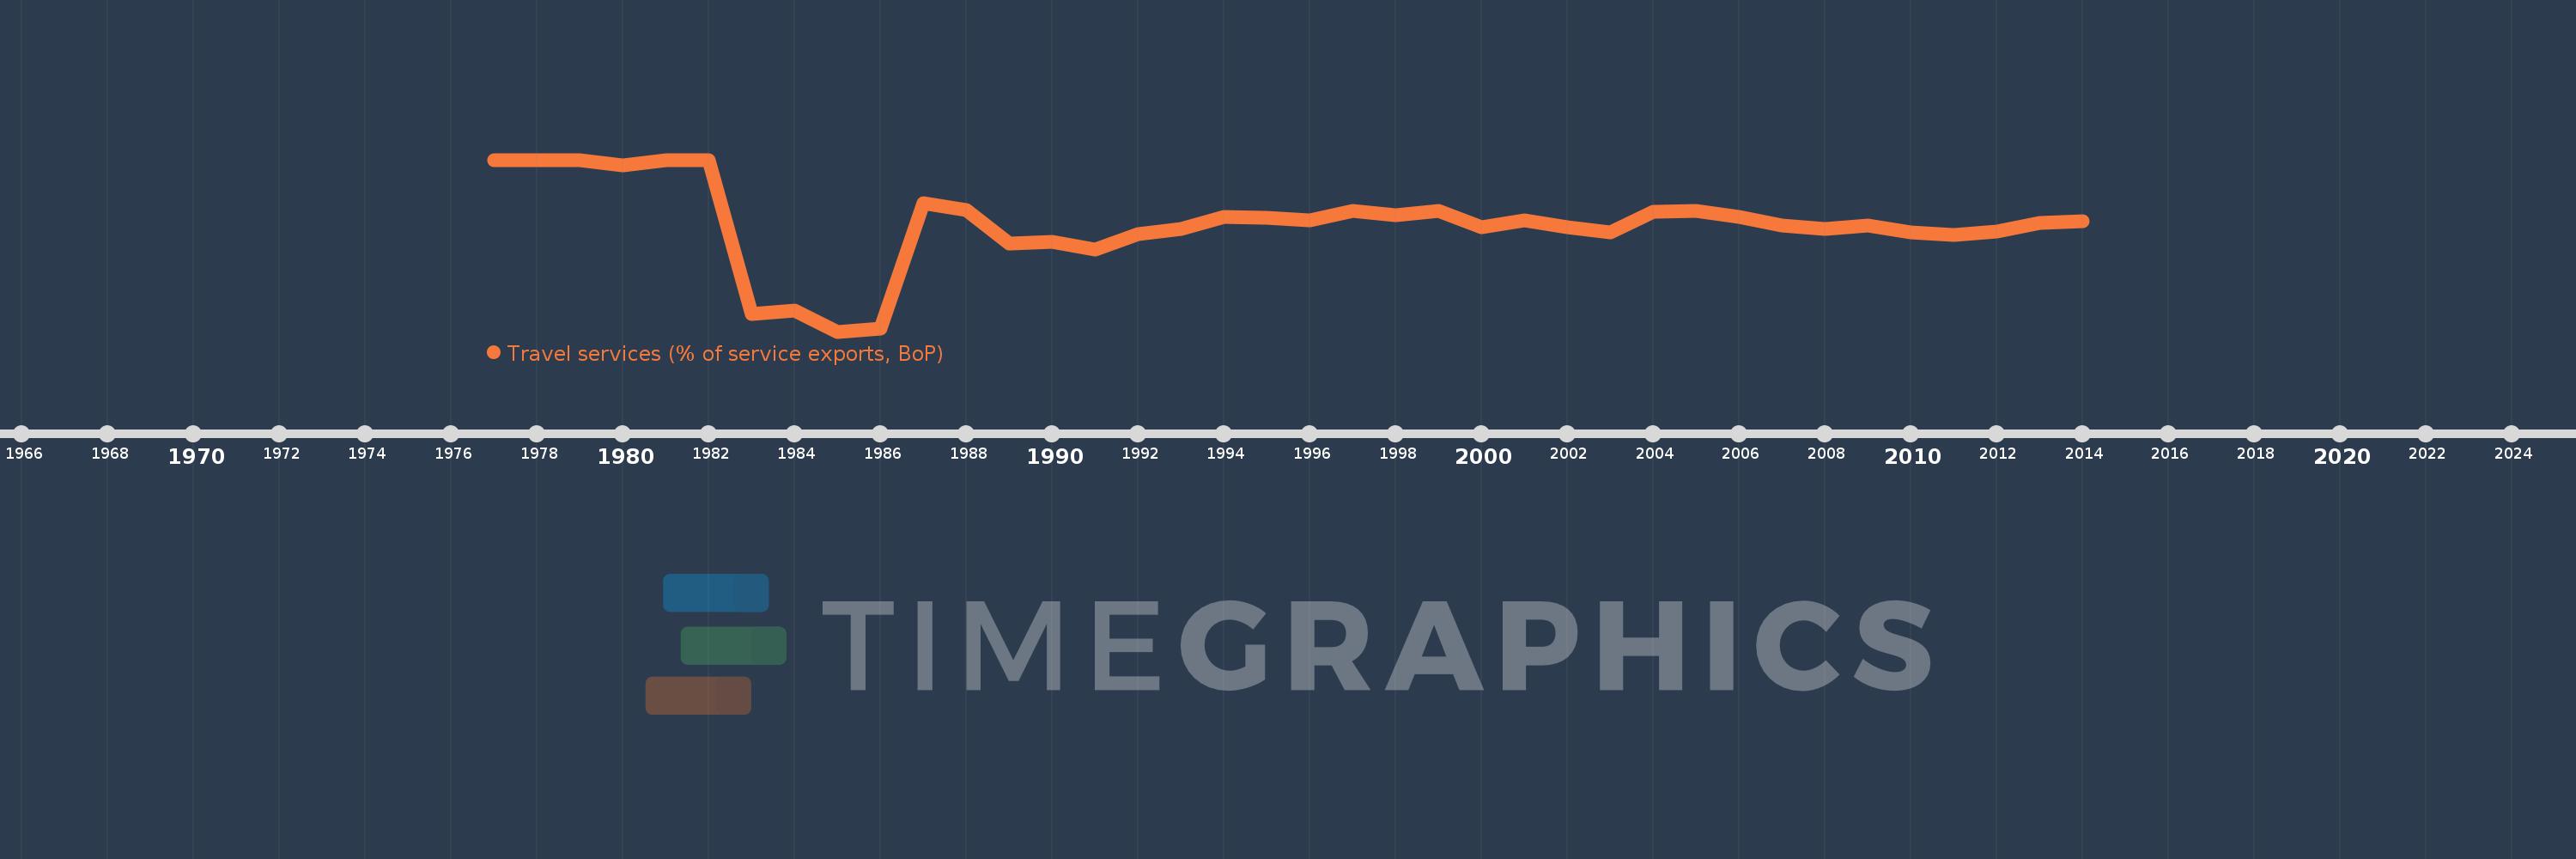
Travel services (% of service exports, BoP)
2014,2013,2012,2011,2010,2009,2008,2007,2006,2005,2004,2003,2002,2001,2000,1999,1998,1997,1996,1995,1994,1993,1992,1991,1990,1989,1988,1987,1986,1985,1984,1983,1982,1981,1980,1979,1978,1977
This statistics in other country:
AfghanistanAlbaniaAlgeriaAngolaAntigua and BarbudaArab WorldArgentinaArmeniaArubaAustraliaAustriaAzerbaijanBahamas, TheBahrainBangladeshBarbadosBelarusBelgiumBelizeBeninBermudaBhutanBoliviaBosnia and HerzegovinaBotswanaBrazilBrunei DarussalamBulgariaBurkina FasoBurundiCabo VerdeCambodiaCameroonCanadaCaribbean small statesCentral African RepublicCentral Europe and the BalticsChadChileChinaColombiaComorosCongo, Dem. Rep.Congo, Rep.Costa RicaCote d'IvoireCroatiaCuracaoCyprusCzech RepublicDenmarkDjiboutiDominicaDominican RepublicEarly-demographic dividendEast Asia & PacificEast Asia & Pacific (excluding high income)East Asia & Pacific (IDA & IBRD countries)EcuadorEgypt, Arab Rep.El SalvadorEritreaEstoniaEthiopiaEuro areaEurope & Central AsiaEurope & Central Asia (excluding high income)Europe & Central Asia (IDA & IBRD countries)European UnionFaroe IslandsFijiFinlandFragile and conflict affected situationsFranceFrench PolynesiaGabonGambia, TheGeorgiaGermanyGhanaGreeceGrenadaGuatemalaGuineaGuinea-BissauGuyanaHaitiHeavily indebted poor countries (HIPC)High incomeHondurasHong Kong SAR, ChinaHungaryIBRD onlyIcelandIDA & IBRD totalIDA onlyIDA totalIndiaIndonesiaIran, Islamic Rep.IraqIrelandIsraelItalyJamaicaJapanJordanKazakhstanKenyaKiribatiKorea, Rep.KosovoKuwaitKyrgyz RepublicLao PDRLate-demographic dividendLatin America & Caribbean Latin America & Caribbean (excluding high income)Latin America & the Caribbean (IDA & IBRD countries)LatviaLeast developed countries: UN classificationLebanonLesothoLiberiaLibyaLithuaniaLow & middle incomeLow incomeLower middle incomeLuxembourgMacao SAR, ChinaMacedonia, FYRMadagascarMalawiMalaysiaMaldivesMaliMaltaMarshall IslandsMauritaniaMauritiusMexicoMicronesia, Fed. Sts.Middle East & North Africa (excluding high income)Middle East & North Africa (IDA & IBRD countries)Middle incomeMoldovaMongoliaMontenegroMoroccoMozambiqueMyanmarNamibiaNepalNetherlandsNew CaledoniaNew ZealandNicaraguaNigerNigeriaNorth AmericaNorwayOECD membersOmanOther small statesPacific island small statesPakistanPalauPanamaPapua New GuineaParaguayPeruPhilippinesPolandPortugalPost-demographic dividendPre-demographic dividendQatarRomaniaRussian FederationRwandaSamoaSao Tome and PrincipeSaudi ArabiaSenegalSerbiaSeychellesSierra LeoneSingaporeSint Maarten (Dutch part)Slovak RepublicSloveniaSmall statesSolomon IslandsSouth AfricaSouth AsiaSouth Asia (IDA & IBRD)South SudanSpainSri LankaSt. Kitts and NevisSt. LuciaSt. Vincent and the GrenadinesSub-Saharan Africa Sub-Saharan Africa (excluding high income)Sub-Saharan Africa (IDA & IBRD countries)SudanSurinameSwazilandSwedenSwitzerlandSyrian Arab RepublicTajikistanTanzaniaThailandTimor-LesteTogoTongaTrinidad and TobagoTunisiaTurkeyTuvaluUgandaUkraineUnited KingdomUnited StatesUpper middle incomeUruguayVanuatuVenezuela, RBWest Bank and GazaWorldYemen, Rep.ZambiaZimbabwe Timeline:
This timeline shows a graph from 1977 to 2014 of St. Lucia. No data until 1976. Number of actual observations by date: 38.
Source name:
World Development Indicators
Source organization:
International Monetary Fund, Balance of Payments Statistics Yearbook and data files.
Categories, topics:
Economy & Growth, Trade
Last updated:
apr 23, 2017
Indicators value changes by year
Minimum:
62.188
jan 1, 1985
At the date of observation
Value
Absolute change
Change from previous value
jan 1, 1977
100.0
+100.0
0.0%
jan 1, 1978
100.0
0.0
0.0%
jan 1, 1979
100.0
0.0
0.0%
jan 1, 1980
98.817
-1.183
-1.18%
jan 1, 1981
100.0
+1.183
1.2%
jan 1, 1982
100.0
0.0
0.0%
jan 1, 1983
65.996
-34.004
-34.0%
jan 1, 1984
66.79
+0.794
1.2%
jan 1, 1985
62.188
-4.602
-6.89%
jan 1, 1986
62.878
+0.69
1.11%
jan 1, 1987
90.388
+27.51
43.75%
jan 1, 1988
88.864
-1.524
-1.69%
jan 1, 1989
81.574
-7.29
-8.2%
jan 1, 1990
81.983
+0.409
0.5%
jan 1, 1991
80.326
-1.657
-2.02%
jan 1, 1992
83.709
+3.383
4.21%
jan 1, 1993
84.795
+1.087
1.3%
jan 1, 1994
87.454
+2.659
3.14%
jan 1, 1995
87.146
-0.309
-0.35%
jan 1, 1996
86.588
-0.557
-0.64%
jan 1, 1997
88.672
+2.084
2.41%
jan 1, 1998
87.815
-0.858
-0.97%
jan 1, 1999
88.676
+0.861
0.98%
jan 1, 2000
85.2
-3.476
-3.92%
jan 1, 2001
86.579
+1.378
1.62%
jan 1, 2002
85.171
-1.407
-1.63%
jan 1, 2003
84.044
-1.127
-1.32%
jan 1, 2004
88.613
+4.569
5.44%
jan 1, 2005
88.723
+0.11
0.12%
jan 1, 2006
87.507
-1.216
-1.37%
jan 1, 2007
85.559
-1.948
-2.23%
jan 1, 2008
84.763
-0.795
-0.93%
jan 1, 2009
85.535
+0.772
0.91%
jan 1, 2010
83.995
-1.54
-1.8%
jan 1, 2011
83.472
-0.524
-0.62%
jan 1, 2012
84.231
+0.759
0.91%
jan 1, 2013
86.12
+1.889
2.24%
jan 1, 2014
86.558
+0.439
0.51%
Ranking of countries by current statistics by years


Comments: