29
/
en
AIzaSyAYiBZKx7MnpbEhh9jyipgxe19OcubqV5w
April 1, 2024
37078
IBRD only
IBD
false
2
1
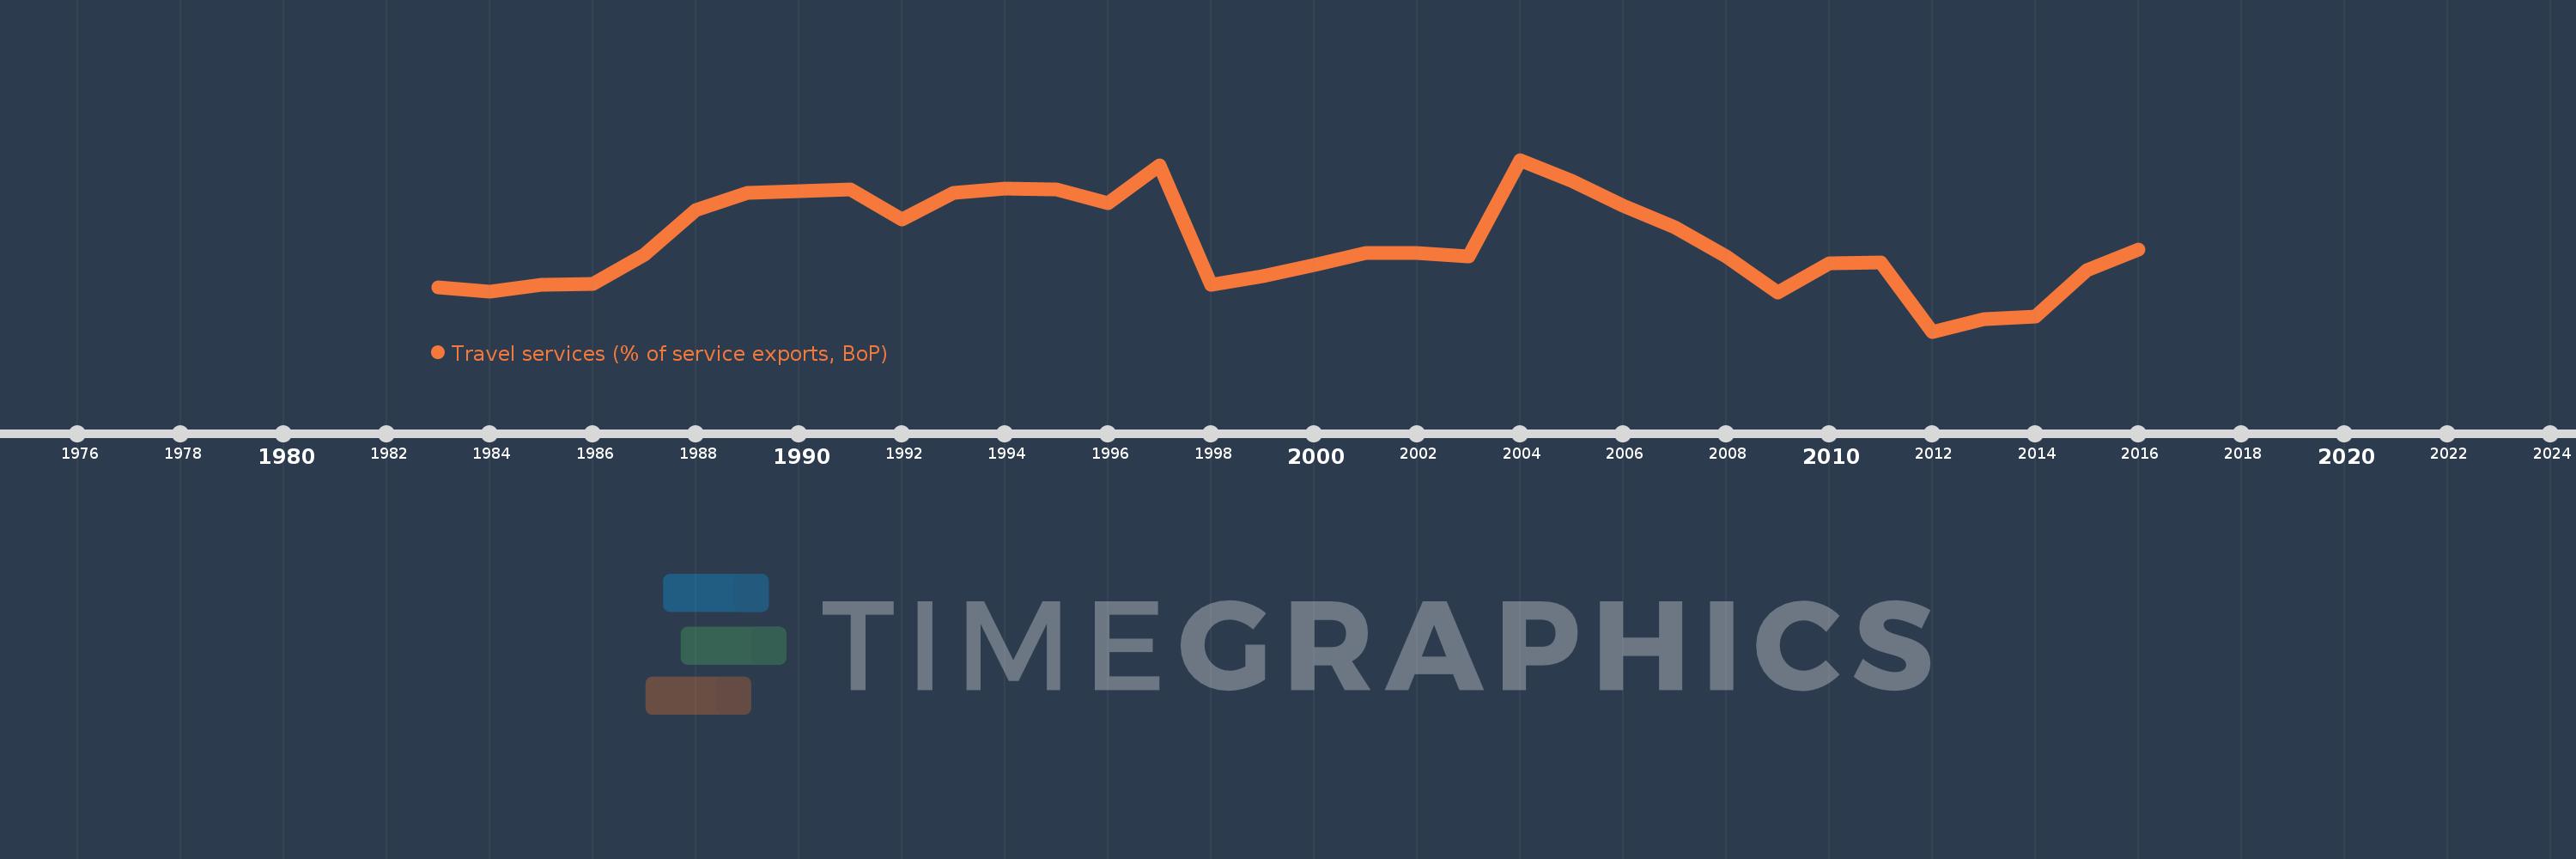
Travel services (% of service exports, BoP)
2016,2015,2014,2013,2012,2011,2010,2009,2008,2007,2006,2005,2004,2003,2002,2001,2000,1999,1998,1997,1996,1995,1994,1993,1992,1991,1990,1989,1988,1987,1986,1985,1984,1983
This statistics in other country:
AfghanistanAlbaniaAlgeriaAngolaAntigua and BarbudaArab WorldArgentinaArmeniaArubaAustraliaAustriaAzerbaijanBahamas, TheBahrainBangladeshBarbadosBelarusBelgiumBelizeBeninBermudaBhutanBoliviaBosnia and HerzegovinaBotswanaBrazilBrunei DarussalamBulgariaBurkina FasoBurundiCabo VerdeCambodiaCameroonCanadaCaribbean small statesCentral African RepublicCentral Europe and the BalticsChadChileChinaColombiaComorosCongo, Dem. Rep.Congo, Rep.Costa RicaCote d'IvoireCroatiaCuracaoCyprusCzech RepublicDenmarkDjiboutiDominicaDominican RepublicEarly-demographic dividendEast Asia & PacificEast Asia & Pacific (excluding high income)East Asia & Pacific (IDA & IBRD countries)EcuadorEgypt, Arab Rep.El SalvadorEritreaEstoniaEthiopiaEuro areaEurope & Central AsiaEurope & Central Asia (excluding high income)Europe & Central Asia (IDA & IBRD countries)European UnionFaroe IslandsFijiFinlandFragile and conflict affected situationsFranceFrench PolynesiaGabonGambia, TheGeorgiaGermanyGhanaGreeceGrenadaGuatemalaGuineaGuinea-BissauGuyanaHaitiHeavily indebted poor countries (HIPC)High incomeHondurasHong Kong SAR, ChinaHungaryIBRD onlyIcelandIDA & IBRD totalIDA onlyIDA totalIndiaIndonesiaIran, Islamic Rep.IraqIrelandIsraelItalyJamaicaJapanJordanKazakhstanKenyaKiribatiKorea, Rep.KosovoKuwaitKyrgyz RepublicLao PDRLate-demographic dividendLatin America & Caribbean Latin America & Caribbean (excluding high income)Latin America & the Caribbean (IDA & IBRD countries)LatviaLeast developed countries: UN classificationLebanonLesothoLiberiaLibyaLithuaniaLow & middle incomeLow incomeLower middle incomeLuxembourgMacao SAR, ChinaMacedonia, FYRMadagascarMalawiMalaysiaMaldivesMaliMaltaMarshall IslandsMauritaniaMauritiusMexicoMicronesia, Fed. Sts.Middle East & North Africa (excluding high income)Middle East & North Africa (IDA & IBRD countries)Middle incomeMoldovaMongoliaMontenegroMoroccoMozambiqueMyanmarNamibiaNepalNetherlandsNew CaledoniaNew ZealandNicaraguaNigerNigeriaNorth AmericaNorwayOECD membersOmanOther small statesPacific island small statesPakistanPalauPanamaPapua New GuineaParaguayPeruPhilippinesPolandPortugalPost-demographic dividendPre-demographic dividendQatarRomaniaRussian FederationRwandaSamoaSao Tome and PrincipeSaudi ArabiaSenegalSerbiaSeychellesSierra LeoneSingaporeSint Maarten (Dutch part)Slovak RepublicSloveniaSmall statesSolomon IslandsSouth AfricaSouth AsiaSouth Asia (IDA & IBRD)South SudanSpainSri LankaSt. Kitts and NevisSt. LuciaSt. Vincent and the GrenadinesSub-Saharan Africa Sub-Saharan Africa (excluding high income)Sub-Saharan Africa (IDA & IBRD countries)SudanSurinameSwazilandSwedenSwitzerlandSyrian Arab RepublicTajikistanTanzaniaThailandTimor-LesteTogoTongaTrinidad and TobagoTunisiaTurkeyTuvaluUgandaUkraineUnited KingdomUnited StatesUpper middle incomeUruguayVanuatuVenezuela, RBWest Bank and GazaWorldYemen, Rep.ZambiaZimbabwe Timeline:
This timeline shows a graph from 1983 to 2016 of IBRD only. No data until 1982. Number of actual observations by date: 34.
Source name:
World Development Indicators
Source organization:
International Monetary Fund, Balance of Payments Statistics Yearbook and data files.
Categories, topics:
Economy & Growth, Trade
Last updated:
apr 23, 2017
Indicators value changes by year
Minimum:
32.023
jan 1, 2012
Maximum:
42.301
jan 1, 2004
At the date of observation
Value
Absolute change
Change from previous value
jan 1, 1983
34.647
+34.647
0.0%
jan 1, 1984
34.414
-0.233
-0.67%
jan 1, 1985
34.814
+0.4
1.16%
jan 1, 1986
34.855
+0.041
0.12%
jan 1, 1987
36.604
+1.749
5.02%
jan 1, 1988
39.298
+2.694
7.36%
jan 1, 1989
40.345
+1.047
2.66%
jan 1, 1990
40.402
+0.057
0.14%
jan 1, 1991
40.513
+0.11
0.27%
jan 1, 1992
38.705
-1.807
-4.46%
jan 1, 1993
40.302
+1.597
4.13%
jan 1, 1994
40.577
+0.274
0.68%
jan 1, 1995
40.535
-0.041
-0.1%
jan 1, 1996
39.726
-0.809
-2.0%
jan 1, 1997
41.962
+2.236
5.63%
jan 1, 1998
34.834
-7.128
-16.99%
jan 1, 1999
35.336
+0.502
1.44%
jan 1, 2000
36.021
+0.685
1.94%
jan 1, 2001
36.735
+0.713
1.98%
jan 1, 2002
36.707
-0.028
-0.08%
jan 1, 2003
36.525
-0.181
-0.49%
jan 1, 2004
42.301
+5.776
15.81%
jan 1, 2005
41.064
-1.238
-2.93%
jan 1, 2006
39.534
-1.529
-3.72%
jan 1, 2007
38.243
-1.291
-3.27%
jan 1, 2008
36.519
-1.723
-4.51%
jan 1, 2009
34.379
-2.141
-5.86%
jan 1, 2010
36.089
+1.711
4.98%
jan 1, 2011
36.16
+0.071
0.2%
jan 1, 2012
32.023
-4.137
-11.44%
jan 1, 2013
32.757
+0.734
2.29%
jan 1, 2014
32.902
+0.144
0.44%
jan 1, 2015
35.718
+2.817
8.56%
jan 1, 2016
36.956
+1.237
3.46%
Ranking of countries by current statistics by years


Comments: