29
/
en
AIzaSyAYiBZKx7MnpbEhh9jyipgxe19OcubqV5w
April 1, 2024
224422
Philippines
PHL
true
2
1
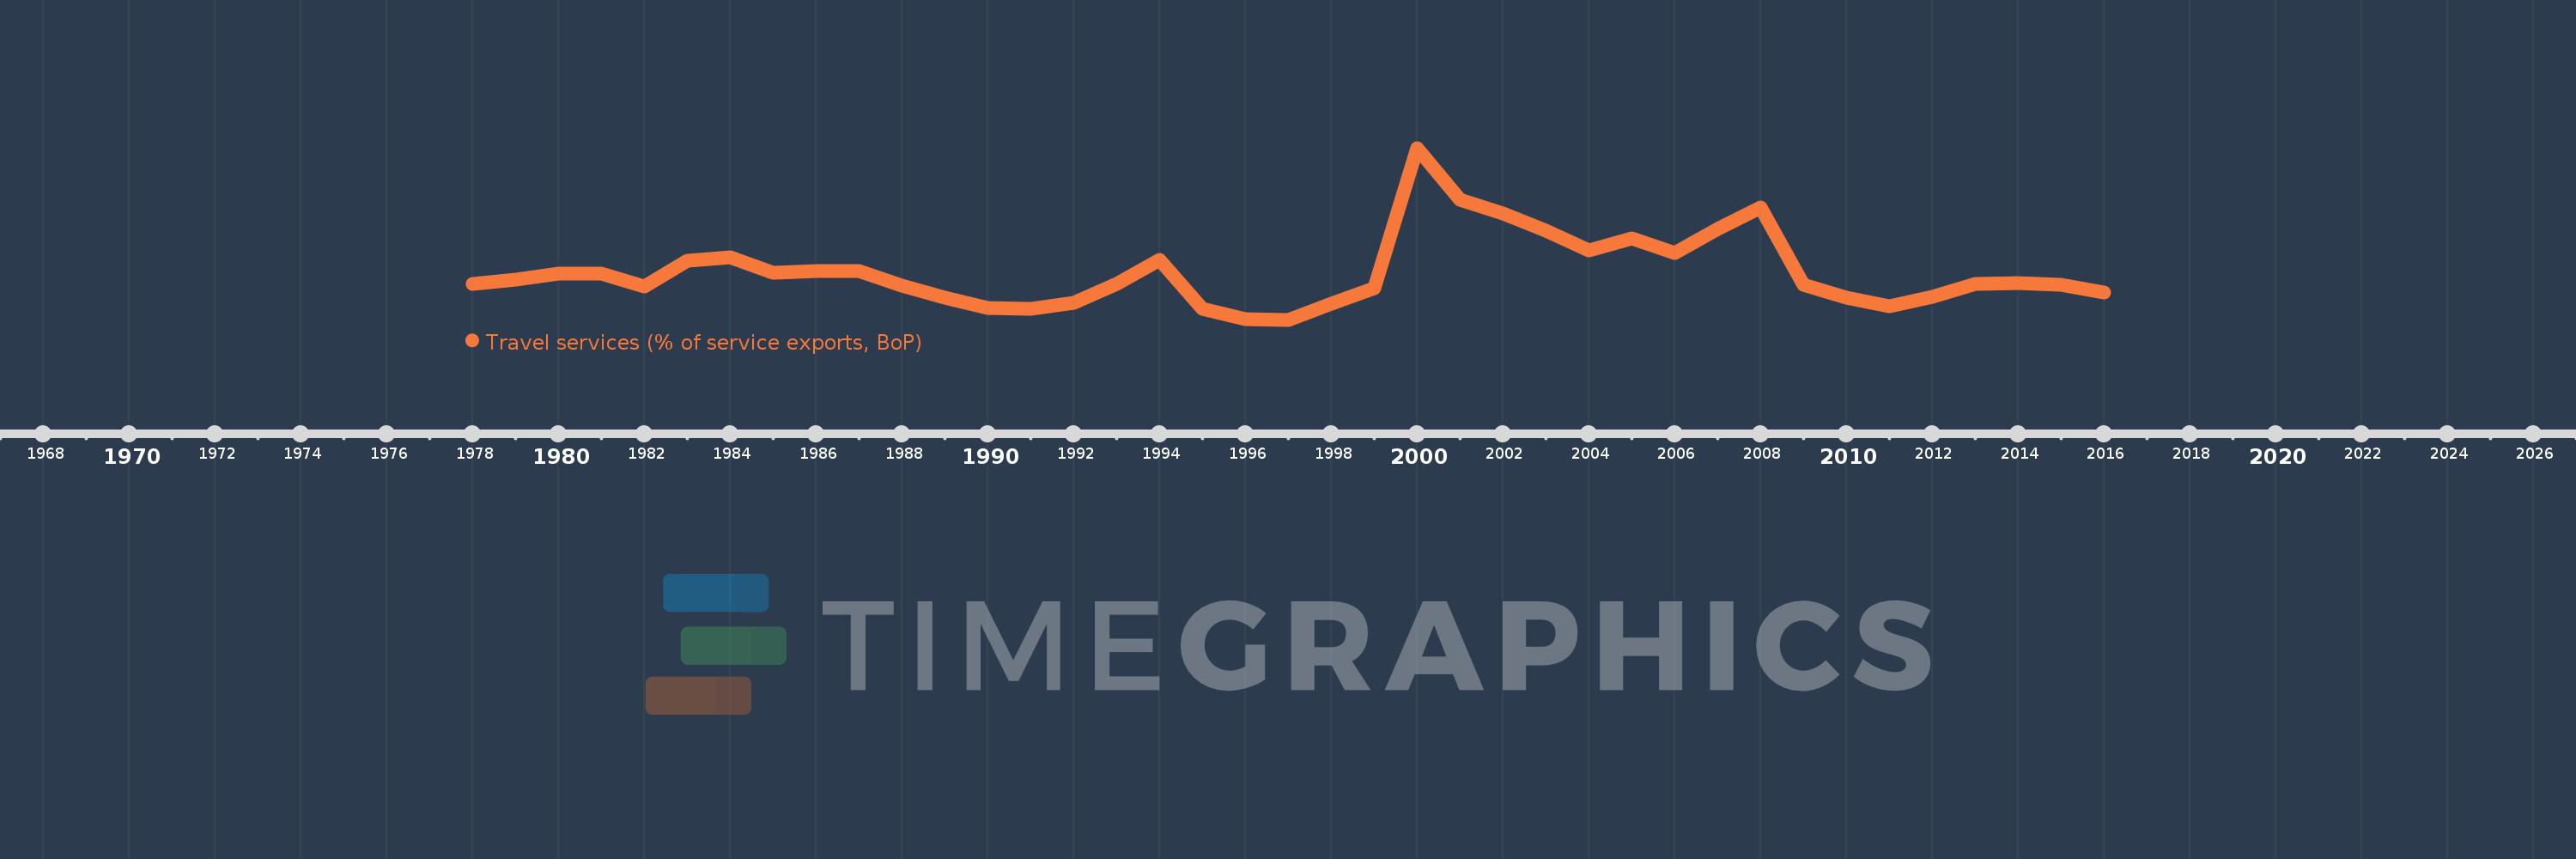
Travel services (% of service exports, BoP)
2016,2015,2014,2013,2012,2011,2010,2009,2008,2007,2006,2005,2004,2003,2002,2001,2000,1999,1998,1997,1996,1995,1994,1993,1992,1991,1990,1989,1988,1987,1986,1985,1984,1983,1982,1981,1980,1979,1978
This statistics in other country:
AfghanistanAlbaniaAlgeriaAngolaAntigua and BarbudaArab WorldArgentinaArmeniaArubaAustraliaAustriaAzerbaijanBahamas, TheBahrainBangladeshBarbadosBelarusBelgiumBelizeBeninBermudaBhutanBoliviaBosnia and HerzegovinaBotswanaBrazilBrunei DarussalamBulgariaBurkina FasoBurundiCabo VerdeCambodiaCameroonCanadaCaribbean small statesCentral African RepublicCentral Europe and the BalticsChadChileChinaColombiaComorosCongo, Dem. Rep.Congo, Rep.Costa RicaCote d'IvoireCroatiaCuracaoCyprusCzech RepublicDenmarkDjiboutiDominicaDominican RepublicEarly-demographic dividendEast Asia & PacificEast Asia & Pacific (excluding high income)East Asia & Pacific (IDA & IBRD countries)EcuadorEgypt, Arab Rep.El SalvadorEritreaEstoniaEthiopiaEuro areaEurope & Central AsiaEurope & Central Asia (excluding high income)Europe & Central Asia (IDA & IBRD countries)European UnionFaroe IslandsFijiFinlandFragile and conflict affected situationsFranceFrench PolynesiaGabonGambia, TheGeorgiaGermanyGhanaGreeceGrenadaGuatemalaGuineaGuinea-BissauGuyanaHaitiHeavily indebted poor countries (HIPC)High incomeHondurasHong Kong SAR, ChinaHungaryIBRD onlyIcelandIDA & IBRD totalIDA onlyIDA totalIndiaIndonesiaIran, Islamic Rep.IraqIrelandIsraelItalyJamaicaJapanJordanKazakhstanKenyaKiribatiKorea, Rep.KosovoKuwaitKyrgyz RepublicLao PDRLate-demographic dividendLatin America & Caribbean Latin America & Caribbean (excluding high income)Latin America & the Caribbean (IDA & IBRD countries)LatviaLeast developed countries: UN classificationLebanonLesothoLiberiaLibyaLithuaniaLow & middle incomeLow incomeLower middle incomeLuxembourgMacao SAR, ChinaMacedonia, FYRMadagascarMalawiMalaysiaMaldivesMaliMaltaMarshall IslandsMauritaniaMauritiusMexicoMicronesia, Fed. Sts.Middle East & North Africa (excluding high income)Middle East & North Africa (IDA & IBRD countries)Middle incomeMoldovaMongoliaMontenegroMoroccoMozambiqueMyanmarNamibiaNepalNetherlandsNew CaledoniaNew ZealandNicaraguaNigerNigeriaNorth AmericaNorwayOECD membersOmanOther small statesPacific island small statesPakistanPalauPanamaPapua New GuineaParaguayPeruPhilippinesPolandPortugalPost-demographic dividendPre-demographic dividendQatarRomaniaRussian FederationRwandaSamoaSao Tome and PrincipeSaudi ArabiaSenegalSerbiaSeychellesSierra LeoneSingaporeSint Maarten (Dutch part)Slovak RepublicSloveniaSmall statesSolomon IslandsSouth AfricaSouth AsiaSouth Asia (IDA & IBRD)South SudanSpainSri LankaSt. Kitts and NevisSt. LuciaSt. Vincent and the GrenadinesSub-Saharan Africa Sub-Saharan Africa (excluding high income)Sub-Saharan Africa (IDA & IBRD countries)SudanSurinameSwazilandSwedenSwitzerlandSyrian Arab RepublicTajikistanTanzaniaThailandTimor-LesteTogoTongaTrinidad and TobagoTunisiaTurkeyTuvaluUgandaUkraineUnited KingdomUnited StatesUpper middle incomeUruguayVanuatuVenezuela, RBWest Bank and GazaWorldYemen, Rep.ZambiaZimbabwe Timeline:
This timeline shows a graph from 1978 to 2016 of Philippines. No data until 1977. Number of actual observations by date: 39.
Source name:
World Development Indicators
Source organization:
International Monetary Fund, Balance of Payments Statistics Yearbook and data files.
Categories, topics:
Economy & Growth, Trade
Last updated:
apr 23, 2017
Indicators value changes by year
Minimum:
11.941
jan 1, 1997
Maximum:
49.807
jan 1, 2000
At the date of observation
Value
Absolute change
Change from previous value
jan 1, 1978
19.782
+19.782
0.0%
jan 1, 1979
20.731
+0.949
4.8%
jan 1, 1980
22.119
+1.388
6.7%
jan 1, 1981
22.115
-0.004
-0.02%
jan 1, 1982
19.207
-2.908
-13.15%
jan 1, 1983
24.945
+5.737
29.87%
jan 1, 1984
25.719
+0.774
3.1%
jan 1, 1985
22.29
-3.429
-13.33%
jan 1, 1986
22.64
+0.35
1.57%
jan 1, 1987
22.622
-0.017
-0.08%
jan 1, 1988
19.531
-3.091
-13.67%
jan 1, 1989
16.784
-2.747
-14.06%
jan 1, 1990
14.543
-2.241
-13.35%
jan 1, 1991
14.365
-0.178
-1.22%
jan 1, 1992
15.599
+1.234
8.59%
jan 1, 1993
19.907
+4.308
27.62%
jan 1, 1994
25.209
+5.301
26.63%
jan 1, 1995
14.376
-10.832
-42.97%
jan 1, 1996
12.152
-2.224
-15.47%
jan 1, 1997
11.941
-0.211
-1.74%
jan 1, 1998
15.465
+3.524
29.52%
jan 1, 1999
18.965
+3.499
22.63%
jan 1, 2000
49.807
+30.842
162.63%
jan 1, 2001
38.37
-11.437
-22.96%
jan 1, 2002
35.385
-2.985
-7.78%
jan 1, 2003
31.587
-3.797
-10.73%
jan 1, 2004
27.25
-4.337
-13.73%
jan 1, 2005
29.913
+2.662
9.77%
jan 1, 2006
26.564
-3.348
-11.19%
jan 1, 2007
32.015
+5.451
20.52%
jan 1, 2008
36.743
+4.728
14.77%
jan 1, 2009
19.63
-17.114
-46.58%
jan 1, 2010
16.827
-2.803
-14.28%
jan 1, 2011
14.875
-1.952
-11.6%
jan 1, 2012
16.938
+2.063
13.87%
jan 1, 2013
19.866
+2.928
17.29%
jan 1, 2014
20.097
+0.231
1.16%
jan 1, 2015
19.727
-0.37
-1.84%
jan 1, 2016
17.994
-1.733
-8.79%
Ranking of countries by current statistics by years


Comments: