29
/
en
AIzaSyAYiBZKx7MnpbEhh9jyipgxe19OcubqV5w
April 1, 2024
59440
Sub-Saharan Africa
SSF
false
2
1
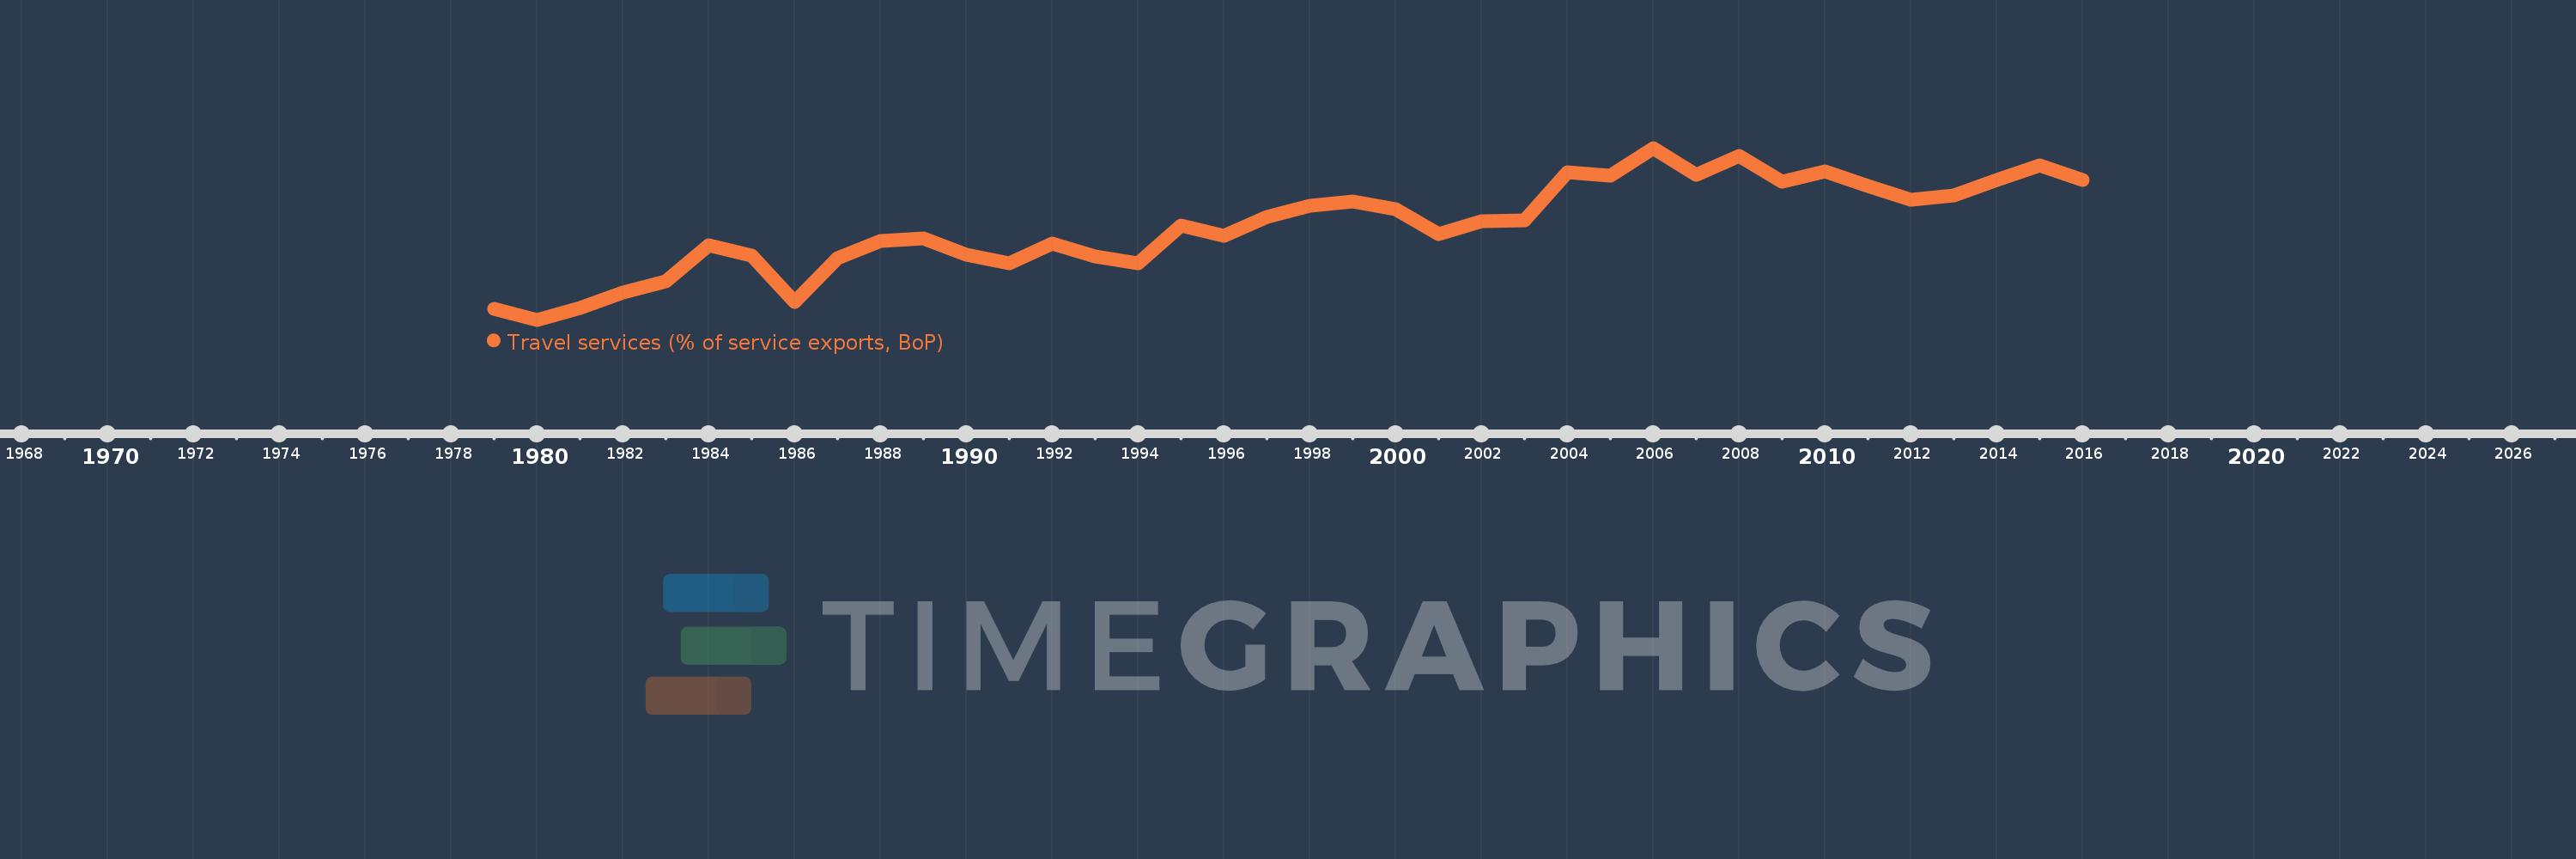
Travel services (% of service exports, BoP)
2016,2015,2014,2013,2012,2011,2010,2009,2008,2007,2006,2005,2004,2003,2002,2001,2000,1999,1998,1997,1996,1995,1994,1993,1992,1991,1990,1989,1988,1987,1986,1985,1984,1983,1982,1981,1980,1979
This statistics in other country:
AfghanistanAlbaniaAlgeriaAngolaAntigua and BarbudaArab WorldArgentinaArmeniaArubaAustraliaAustriaAzerbaijanBahamas, TheBahrainBangladeshBarbadosBelarusBelgiumBelizeBeninBermudaBhutanBoliviaBosnia and HerzegovinaBotswanaBrazilBrunei DarussalamBulgariaBurkina FasoBurundiCabo VerdeCambodiaCameroonCanadaCaribbean small statesCentral African RepublicCentral Europe and the BalticsChadChileChinaColombiaComorosCongo, Dem. Rep.Congo, Rep.Costa RicaCote d'IvoireCroatiaCuracaoCyprusCzech RepublicDenmarkDjiboutiDominicaDominican RepublicEarly-demographic dividendEast Asia & PacificEast Asia & Pacific (excluding high income)East Asia & Pacific (IDA & IBRD countries)EcuadorEgypt, Arab Rep.El SalvadorEritreaEstoniaEthiopiaEuro areaEurope & Central AsiaEurope & Central Asia (excluding high income)Europe & Central Asia (IDA & IBRD countries)European UnionFaroe IslandsFijiFinlandFragile and conflict affected situationsFranceFrench PolynesiaGabonGambia, TheGeorgiaGermanyGhanaGreeceGrenadaGuatemalaGuineaGuinea-BissauGuyanaHaitiHeavily indebted poor countries (HIPC)High incomeHondurasHong Kong SAR, ChinaHungaryIBRD onlyIcelandIDA & IBRD totalIDA onlyIDA totalIndiaIndonesiaIran, Islamic Rep.IraqIrelandIsraelItalyJamaicaJapanJordanKazakhstanKenyaKiribatiKorea, Rep.KosovoKuwaitKyrgyz RepublicLao PDRLate-demographic dividendLatin America & Caribbean Latin America & Caribbean (excluding high income)Latin America & the Caribbean (IDA & IBRD countries)LatviaLeast developed countries: UN classificationLebanonLesothoLiberiaLibyaLithuaniaLow & middle incomeLow incomeLower middle incomeLuxembourgMacao SAR, ChinaMacedonia, FYRMadagascarMalawiMalaysiaMaldivesMaliMaltaMarshall IslandsMauritaniaMauritiusMexicoMicronesia, Fed. Sts.Middle East & North Africa (excluding high income)Middle East & North Africa (IDA & IBRD countries)Middle incomeMoldovaMongoliaMontenegroMoroccoMozambiqueMyanmarNamibiaNepalNetherlandsNew CaledoniaNew ZealandNicaraguaNigerNigeriaNorth AmericaNorwayOECD membersOmanOther small statesPacific island small statesPakistanPalauPanamaPapua New GuineaParaguayPeruPhilippinesPolandPortugalPost-demographic dividendPre-demographic dividendQatarRomaniaRussian FederationRwandaSamoaSao Tome and PrincipeSaudi ArabiaSenegalSerbiaSeychellesSierra LeoneSingaporeSint Maarten (Dutch part)Slovak RepublicSloveniaSmall statesSolomon IslandsSouth AfricaSouth AsiaSouth Asia (IDA & IBRD)South SudanSpainSri LankaSt. Kitts and NevisSt. LuciaSt. Vincent and the GrenadinesSub-Saharan Africa Sub-Saharan Africa (excluding high income)Sub-Saharan Africa (IDA & IBRD countries)SudanSurinameSwazilandSwedenSwitzerlandSyrian Arab RepublicTajikistanTanzaniaThailandTimor-LesteTogoTongaTrinidad and TobagoTunisiaTurkeyTuvaluUgandaUkraineUnited KingdomUnited StatesUpper middle incomeUruguayVanuatuVenezuela, RBWest Bank and GazaWorldYemen, Rep.ZambiaZimbabwe Timeline:
This timeline shows a graph from 1979 to 2016 of Sub-Saharan Africa . No data until 1978. Number of actual observations by date: 38.
Source name:
World Development Indicators
Source organization:
International Monetary Fund, Balance of Payments Statistics Yearbook and data files.
Categories, topics:
Economy & Growth, Trade
Last updated:
apr 23, 2017
Indicators value changes by year
Minimum:
29.746
jan 1, 1980
Maximum:
49.603
jan 1, 2006
At the date of observation
Value
Absolute change
Change from previous value
jan 1, 1979
30.994
+30.994
0.0%
jan 1, 1980
29.746
-1.248
-4.03%
jan 1, 1981
31.074
+1.328
4.46%
jan 1, 1982
32.929
+1.854
5.97%
jan 1, 1983
34.219
+1.29
3.92%
jan 1, 1984
38.345
+4.126
12.06%
jan 1, 1985
37.12
-1.225
-3.2%
jan 1, 1986
31.797
-5.323
-14.34%
jan 1, 1987
36.88
+5.083
15.99%
jan 1, 1988
38.883
+2.003
5.43%
jan 1, 1989
39.136
+0.252
0.65%
jan 1, 1990
37.288
-1.848
-4.72%
jan 1, 1991
36.227
-1.061
-2.85%
jan 1, 1992
38.526
+2.3
6.35%
jan 1, 1993
37.07
-1.457
-3.78%
jan 1, 1994
36.22
-0.85
-2.29%
jan 1, 1995
40.662
+4.442
12.26%
jan 1, 1996
39.449
-1.212
-2.98%
jan 1, 1997
41.62
+2.171
5.5%
jan 1, 1998
42.923
+1.303
3.13%
jan 1, 1999
43.466
+0.543
1.27%
jan 1, 2000
42.559
-0.907
-2.09%
jan 1, 2001
39.679
-2.88
-6.77%
jan 1, 2002
41.125
+1.447
3.65%
jan 1, 2003
41.227
+0.102
0.25%
jan 1, 2004
46.78
+5.553
13.47%
jan 1, 2005
46.347
-0.433
-0.93%
jan 1, 2006
49.603
+3.256
7.02%
jan 1, 2007
46.517
-3.086
-6.22%
jan 1, 2008
48.662
+2.144
4.61%
jan 1, 2009
45.684
-2.978
-6.12%
jan 1, 2010
46.9
+1.216
2.66%
jan 1, 2011
45.226
-1.674
-3.57%
jan 1, 2012
43.608
-1.618
-3.58%
jan 1, 2013
44.154
+0.546
1.25%
jan 1, 2014
45.905
+1.751
3.96%
jan 1, 2015
47.633
+1.727
3.76%
jan 1, 2016
45.913
-1.72
-3.61%
Ranking of countries by current statistics by years


Comments: