29
/
en
AIzaSyAYiBZKx7MnpbEhh9jyipgxe19OcubqV5w
April 1, 2024
119495
Denmark
DNK
true
2
1
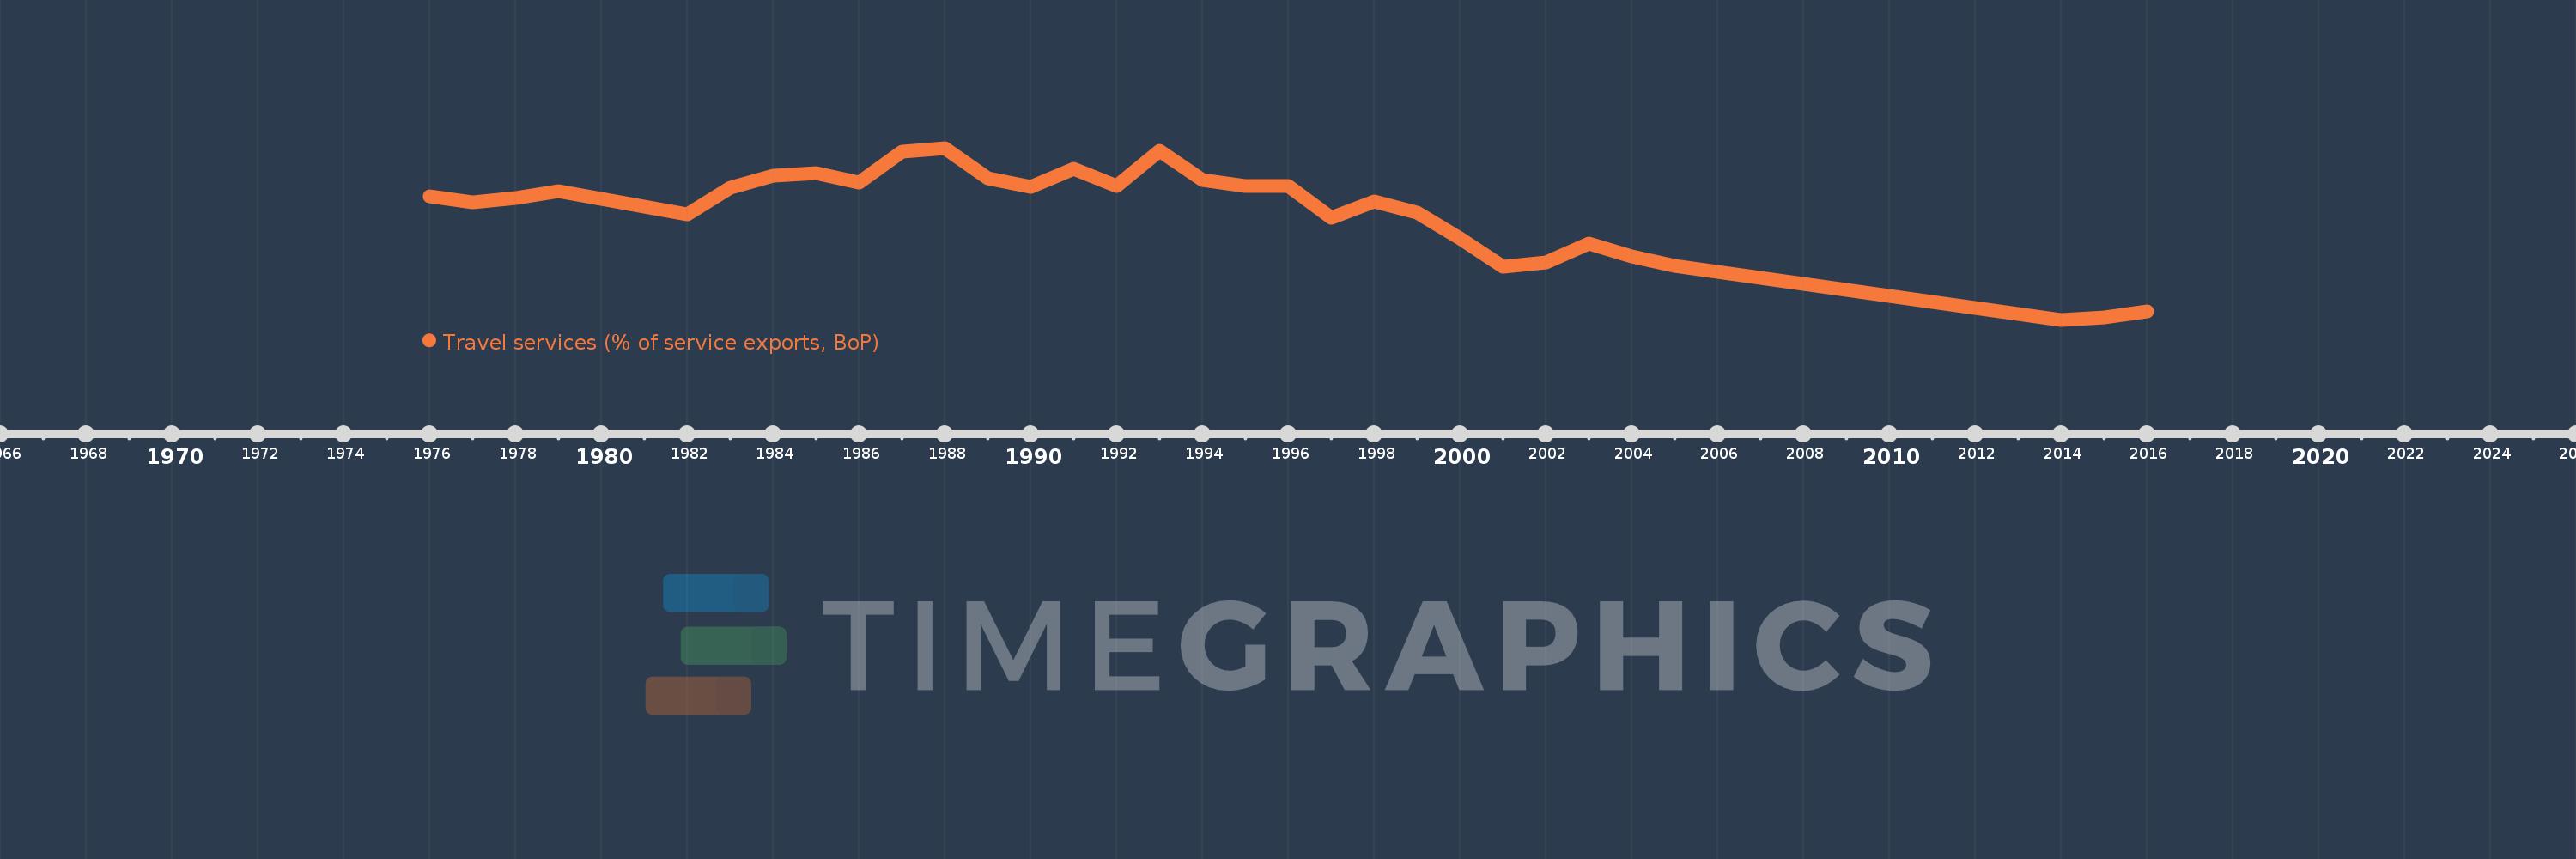
Travel services (% of service exports, BoP)
2016,2015,2014,2005,2004,2003,2002,2001,2000,1999,1998,1997,1996,1995,1994,1993,1992,1991,1990,1989,1988,1987,1986,1985,1984,1983,1982,1979,1978,1977,1976
This statistics in other country:
AfghanistanAlbaniaAlgeriaAngolaAntigua and BarbudaArab WorldArgentinaArmeniaArubaAustraliaAustriaAzerbaijanBahamas, TheBahrainBangladeshBarbadosBelarusBelgiumBelizeBeninBermudaBhutanBoliviaBosnia and HerzegovinaBotswanaBrazilBrunei DarussalamBulgariaBurkina FasoBurundiCabo VerdeCambodiaCameroonCanadaCaribbean small statesCentral African RepublicCentral Europe and the BalticsChadChileChinaColombiaComorosCongo, Dem. Rep.Congo, Rep.Costa RicaCote d'IvoireCroatiaCuracaoCyprusCzech RepublicDenmarkDjiboutiDominicaDominican RepublicEarly-demographic dividendEast Asia & PacificEast Asia & Pacific (excluding high income)East Asia & Pacific (IDA & IBRD countries)EcuadorEgypt, Arab Rep.El SalvadorEritreaEstoniaEthiopiaEuro areaEurope & Central AsiaEurope & Central Asia (excluding high income)Europe & Central Asia (IDA & IBRD countries)European UnionFaroe IslandsFijiFinlandFragile and conflict affected situationsFranceFrench PolynesiaGabonGambia, TheGeorgiaGermanyGhanaGreeceGrenadaGuatemalaGuineaGuinea-BissauGuyanaHaitiHeavily indebted poor countries (HIPC)High incomeHondurasHong Kong SAR, ChinaHungaryIBRD onlyIcelandIDA & IBRD totalIDA onlyIDA totalIndiaIndonesiaIran, Islamic Rep.IraqIrelandIsraelItalyJamaicaJapanJordanKazakhstanKenyaKiribatiKorea, Rep.KosovoKuwaitKyrgyz RepublicLao PDRLate-demographic dividendLatin America & Caribbean Latin America & Caribbean (excluding high income)Latin America & the Caribbean (IDA & IBRD countries)LatviaLeast developed countries: UN classificationLebanonLesothoLiberiaLibyaLithuaniaLow & middle incomeLow incomeLower middle incomeLuxembourgMacao SAR, ChinaMacedonia, FYRMadagascarMalawiMalaysiaMaldivesMaliMaltaMarshall IslandsMauritaniaMauritiusMexicoMicronesia, Fed. Sts.Middle East & North Africa (excluding high income)Middle East & North Africa (IDA & IBRD countries)Middle incomeMoldovaMongoliaMontenegroMoroccoMozambiqueMyanmarNamibiaNepalNetherlandsNew CaledoniaNew ZealandNicaraguaNigerNigeriaNorth AmericaNorwayOECD membersOmanOther small statesPacific island small statesPakistanPalauPanamaPapua New GuineaParaguayPeruPhilippinesPolandPortugalPost-demographic dividendPre-demographic dividendQatarRomaniaRussian FederationRwandaSamoaSao Tome and PrincipeSaudi ArabiaSenegalSerbiaSeychellesSierra LeoneSingaporeSint Maarten (Dutch part)Slovak RepublicSloveniaSmall statesSolomon IslandsSouth AfricaSouth AsiaSouth Asia (IDA & IBRD)South SudanSpainSri LankaSt. Kitts and NevisSt. LuciaSt. Vincent and the GrenadinesSub-Saharan Africa Sub-Saharan Africa (excluding high income)Sub-Saharan Africa (IDA & IBRD countries)SudanSurinameSwazilandSwedenSwitzerlandSyrian Arab RepublicTajikistanTanzaniaThailandTimor-LesteTogoTongaTrinidad and TobagoTunisiaTurkeyTuvaluUgandaUkraineUnited KingdomUnited StatesUpper middle incomeUruguayVanuatuVenezuela, RBWest Bank and GazaWorldYemen, Rep.ZambiaZimbabwe Timeline:
This timeline shows a graph from 1976 to 2016 of Denmark. No data until 1975. Number of actual observations by date: 31.
Source name:
World Development Indicators
Source organization:
International Monetary Fund, Balance of Payments Statistics Yearbook and data files.
Categories, topics:
Economy & Growth, Trade
Last updated:
apr 23, 2017
Indicators value changes by year
Maximum:
28.228
jan 1, 1988
At the date of observation
Value
Absolute change
Change from previous value
jan 1, 1976
23.067
+23.067
0.0%
jan 1, 1977
22.434
-0.633
-2.74%
jan 1, 1978
22.814
+0.38
1.69%
jan 1, 1979
23.639
+0.825
3.62%
jan 1, 1982
21.122
-2.517
-10.65%
jan 1, 1983
23.941
+2.819
13.34%
jan 1, 1984
25.251
+1.311
5.47%
jan 1, 1985
25.492
+0.241
0.95%
jan 1, 1986
24.501
-0.991
-3.89%
jan 1, 1987
27.855
+3.354
13.69%
jan 1, 1988
28.228
+0.373
1.34%
jan 1, 1989
24.981
-3.247
-11.5%
jan 1, 1990
24.064
-0.917
-3.67%
jan 1, 1991
26.019
+1.955
8.12%
jan 1, 1992
24.125
-1.894
-7.28%
jan 1, 1993
27.915
+3.789
15.71%
jan 1, 1994
24.782
-3.133
-11.22%
jan 1, 1995
24.171
-0.611
-2.46%
jan 1, 1996
24.113
-0.058
-0.24%
jan 1, 1997
20.724
-3.389
-14.05%
jan 1, 1998
22.473
+1.749
8.44%
jan 1, 1999
21.272
-1.201
-5.34%
jan 1, 2000
18.507
-2.765
-13.0%
jan 1, 2001
15.477
-3.03
-16.37%
jan 1, 2002
15.928
+0.451
2.92%
jan 1, 2003
17.968
+2.04
12.81%
jan 1, 2004
16.643
-1.325
-7.37%
jan 1, 2005
15.569
-1.075
-6.46%
jan 1, 2014
9.812
-5.757
-36.98%
jan 1, 2015
10.023
+0.211
2.15%
jan 1, 2016
10.747
+0.724
7.22%
Ranking of countries by current statistics by years


Comments: