29
/
en
AIzaSyAYiBZKx7MnpbEhh9jyipgxe19OcubqV5w
April 1, 2024
77355
Bahrain
BHR
true
2
1
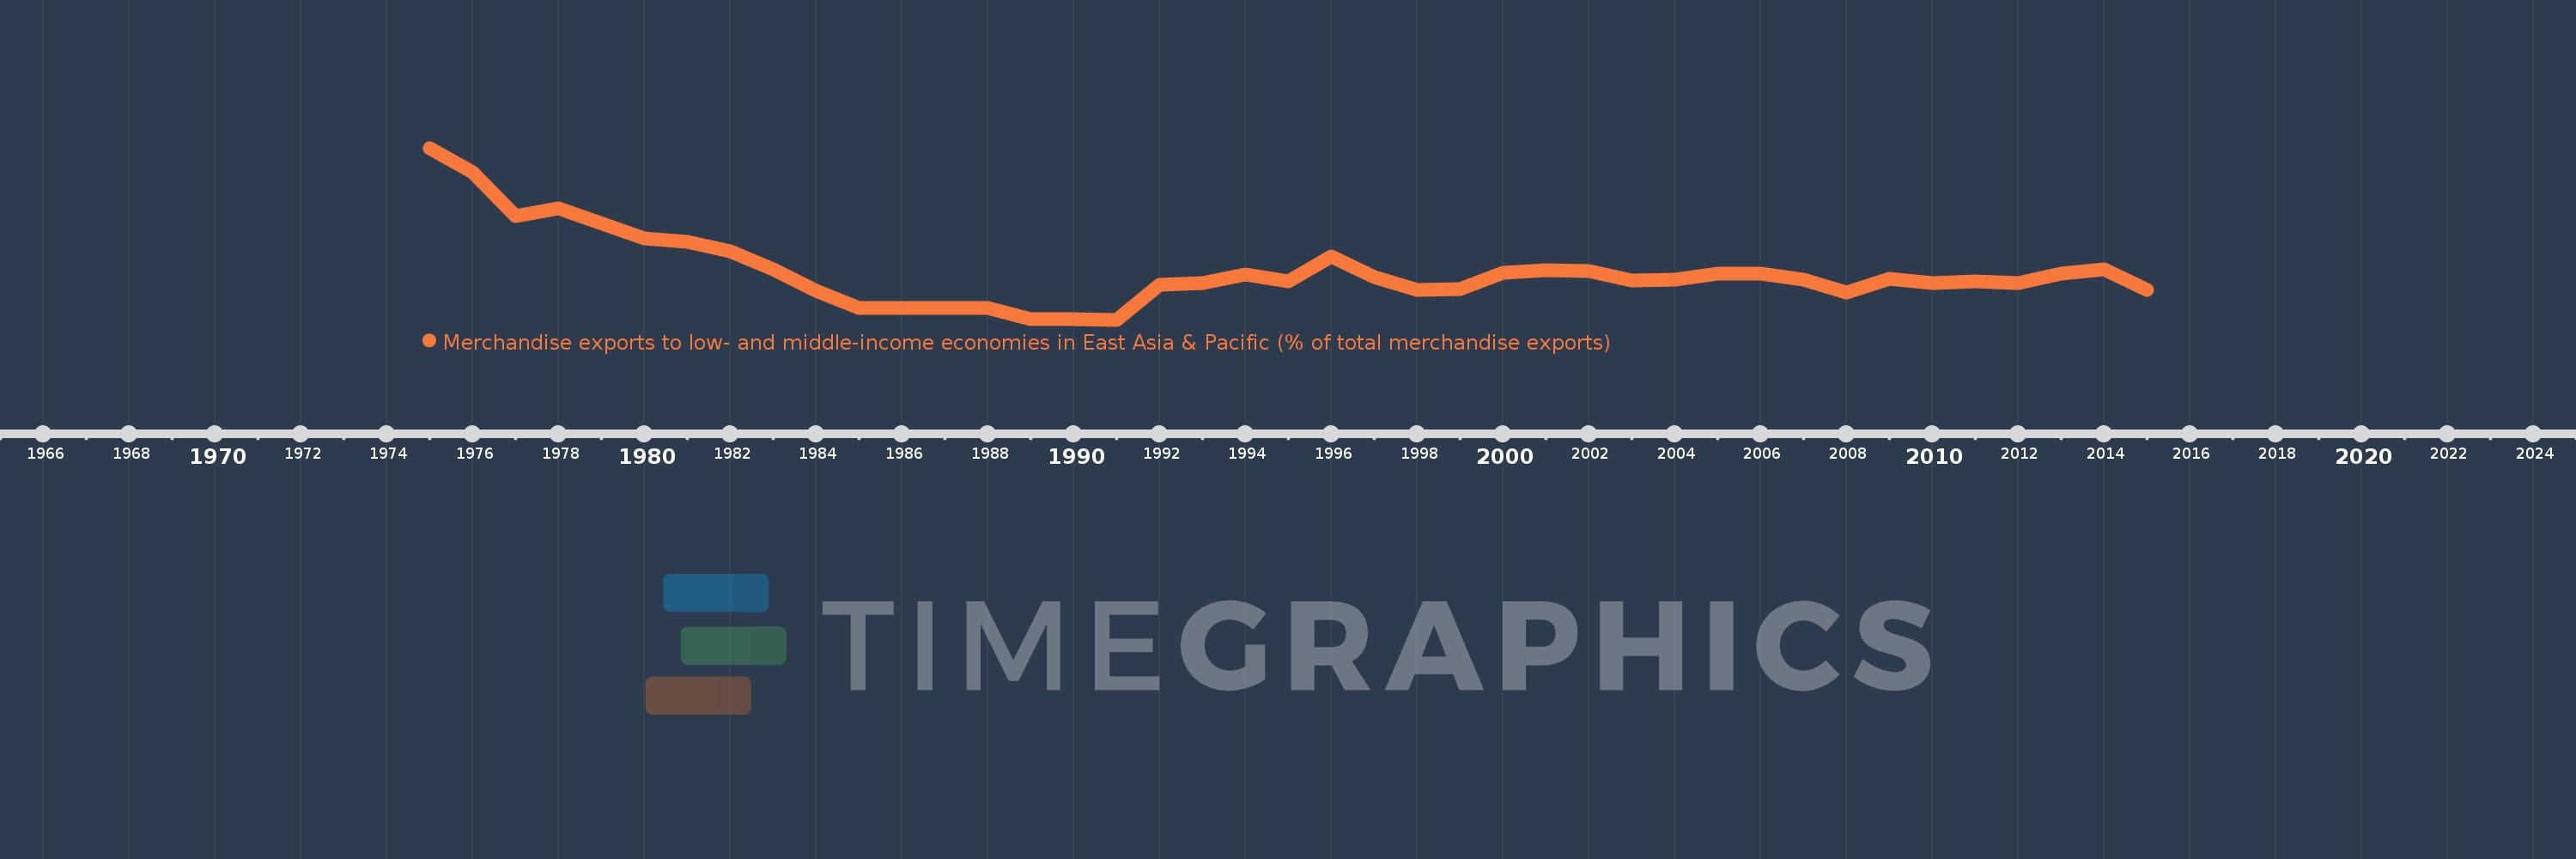
Merchandise exports to low- and middle-income economies in East Asia & Pacific (% of total merchandise exports)
2015,2014,2013,2012,2011,2010,2009,2008,2007,2006,2005,2004,2003,2002,2001,2000,1999,1998,1997,1996,1995,1994,1993,1992,1991,1990,1989,1988,1987,1986,1985,1984,1983,1982,1981,1980,1978,1977,1976,1975
This statistics in other country:
AfghanistanAlbaniaAlgeriaArab WorldArgentinaAustraliaAustriaAzerbaijanBahamas, TheBahrainBangladeshBarbadosBelarusBelgiumBermudaBrazilBrunei DarussalamBulgariaCabo VerdeCambodiaCameroonCanadaCaribbean small statesCentral Europe and the BalticsChileChinaColombiaCosta RicaCote d'IvoireCroatiaCubaCyprusCzech RepublicDenmarkDominicaDominican RepublicEarly-demographic dividendEast Asia & PacificEast Asia & Pacific (excluding high income)East Asia & Pacific (IDA & IBRD countries)EcuadorEgypt, Arab Rep.El SalvadorEstoniaEthiopiaEuro areaEurope & Central AsiaEurope & Central Asia (excluding high income)Europe & Central Asia (IDA & IBRD countries)European UnionFijiFinlandFragile and conflict affected situationsFranceGermanyGhanaGreeceGuatemalaGuyanaHeavily indebted poor countries (HIPC)High incomeHondurasHong Kong SAR, ChinaHungaryIBRD onlyIcelandIDA & IBRD totalIDA blendIDA onlyIDA totalIndiaIndonesiaIran, Islamic Rep.IraqIrelandIsraelItalyJamaicaJapanJordanKazakhstanKenyaKorea, Dem. People’s Rep.Korea, Rep.KuwaitLate-demographic dividendLatin America & Caribbean Latin America & Caribbean (excluding high income)Latin America & the Caribbean (IDA & IBRD countries)LatviaLeast developed countries: UN classificationLebanonLithuaniaLow & middle incomeLow incomeLower middle incomeLuxembourgMacao SAR, ChinaMacedonia, FYRMadagascarMalaysiaMaltaMauritiusMexicoMiddle East & North AfricaMiddle East & North Africa (excluding high income)Middle East & North Africa (IDA & IBRD countries)Middle incomeMoldovaMontenegroMoroccoMozambiqueMyanmarNetherlandsNew CaledoniaNew ZealandNigeriaNorth AmericaNorwayOECD membersOmanOther small statesPacific island small statesPakistanPapua New GuineaParaguayPeruPhilippinesPolandPortugalPost-demographic dividendPre-demographic dividendQatarRomaniaRussian FederationSaudi ArabiaSenegalSerbiaSingaporeSlovak RepublicSloveniaSmall statesSolomon IslandsSomaliaSouth AfricaSouth AsiaSouth Asia (IDA & IBRD)SpainSri LankaSt. LuciaSub-Saharan Africa Sub-Saharan Africa (excluding high income)Sub-Saharan Africa (IDA & IBRD countries)SurinameSwedenSwitzerlandSyrian Arab RepublicTanzaniaThailandTogoTongaTrinidad and TobagoTunisiaTurkeyUgandaUkraineUnited Arab EmiratesUnited KingdomUnited StatesUpper middle incomeVenezuela, RBVietnamWorldYemen, Rep.ZambiaZimbabwe Timeline:
This timeline shows a graph from 1975 to 2015 of Bahrain. No data until 1974. Number of actual observations by date: 40.
Source name:
World Development Indicators
Source organization:
World Bank staff estimates based data from International Monetary Fund's Direction of Trade database.
Categories, topics:
Private Sector, Trade
Last updated:
apr 23, 2017
Indicators value changes by year
At the date of observation
Value
Absolute change
Change from previous value
jan 1, 1975
9.179
+9.179
0.0%
jan 1, 1976
7.908
-1.271
-13.85%
jan 1, 1977
5.584
-2.324
-29.39%
jan 1, 1978
5.989
+0.405
7.26%
jan 1, 1980
4.392
-1.597
-26.66%
jan 1, 1981
4.207
-0.185
-4.21%
jan 1, 1982
3.736
-0.471
-11.19%
jan 1, 1983
2.744
-0.992
-26.55%
jan 1, 1984
1.648
-1.096
-39.95%
jan 1, 1985
0.722
-0.926
-56.18%
jan 1, 1986
0.722
+0.0
0.0%
jan 1, 1987
0.722
0.0
0.0%
jan 1, 1988
0.722
+0.0
0.0%
jan 1, 1989
0.131
-0.591
-81.85%
jan 1, 1990
0.131
0.0
0.0%
jan 1, 1991
0.099
-0.032
-24.49%
jan 1, 1992
1.93
+1.831
1.85K%
jan 1, 1993
2.051
+0.121
6.3%
jan 1, 1994
2.508
+0.457
22.26%
jan 1, 1995
2.144
-0.364
-14.51%
jan 1, 1996
3.453
+1.309
61.07%
jan 1, 1997
2.356
-1.097
-31.77%
jan 1, 1998
1.681
-0.675
-28.65%
jan 1, 1999
1.698
+0.017
1.0%
jan 1, 2000
2.597
+0.899
52.93%
jan 1, 2001
2.708
+0.111
4.28%
jan 1, 2002
2.657
-0.051
-1.89%
jan 1, 2003
2.164
-0.493
-18.56%
jan 1, 2004
2.218
+0.054
2.49%
jan 1, 2005
2.549
+0.331
14.93%
jan 1, 2006
2.559
+0.01
0.4%
jan 1, 2007
2.208
-0.351
-13.71%
jan 1, 2008
1.522
-0.686
-31.07%
jan 1, 2009
2.269
+0.747
49.06%
jan 1, 2010
2.017
-0.252
-11.11%
jan 1, 2011
2.146
+0.13
6.43%
jan 1, 2012
2.055
-0.092
-4.28%
jan 1, 2013
2.523
+0.468
22.8%
jan 1, 2014
2.781
+0.258
10.23%
jan 1, 2015
1.667
-1.114
-40.07%
Ranking of countries by current statistics by years


Comments: