29
/
en
AIzaSyAYiBZKx7MnpbEhh9jyipgxe19OcubqV5w
April 1, 2024
188069
Malaysia
MYS
true
2
1
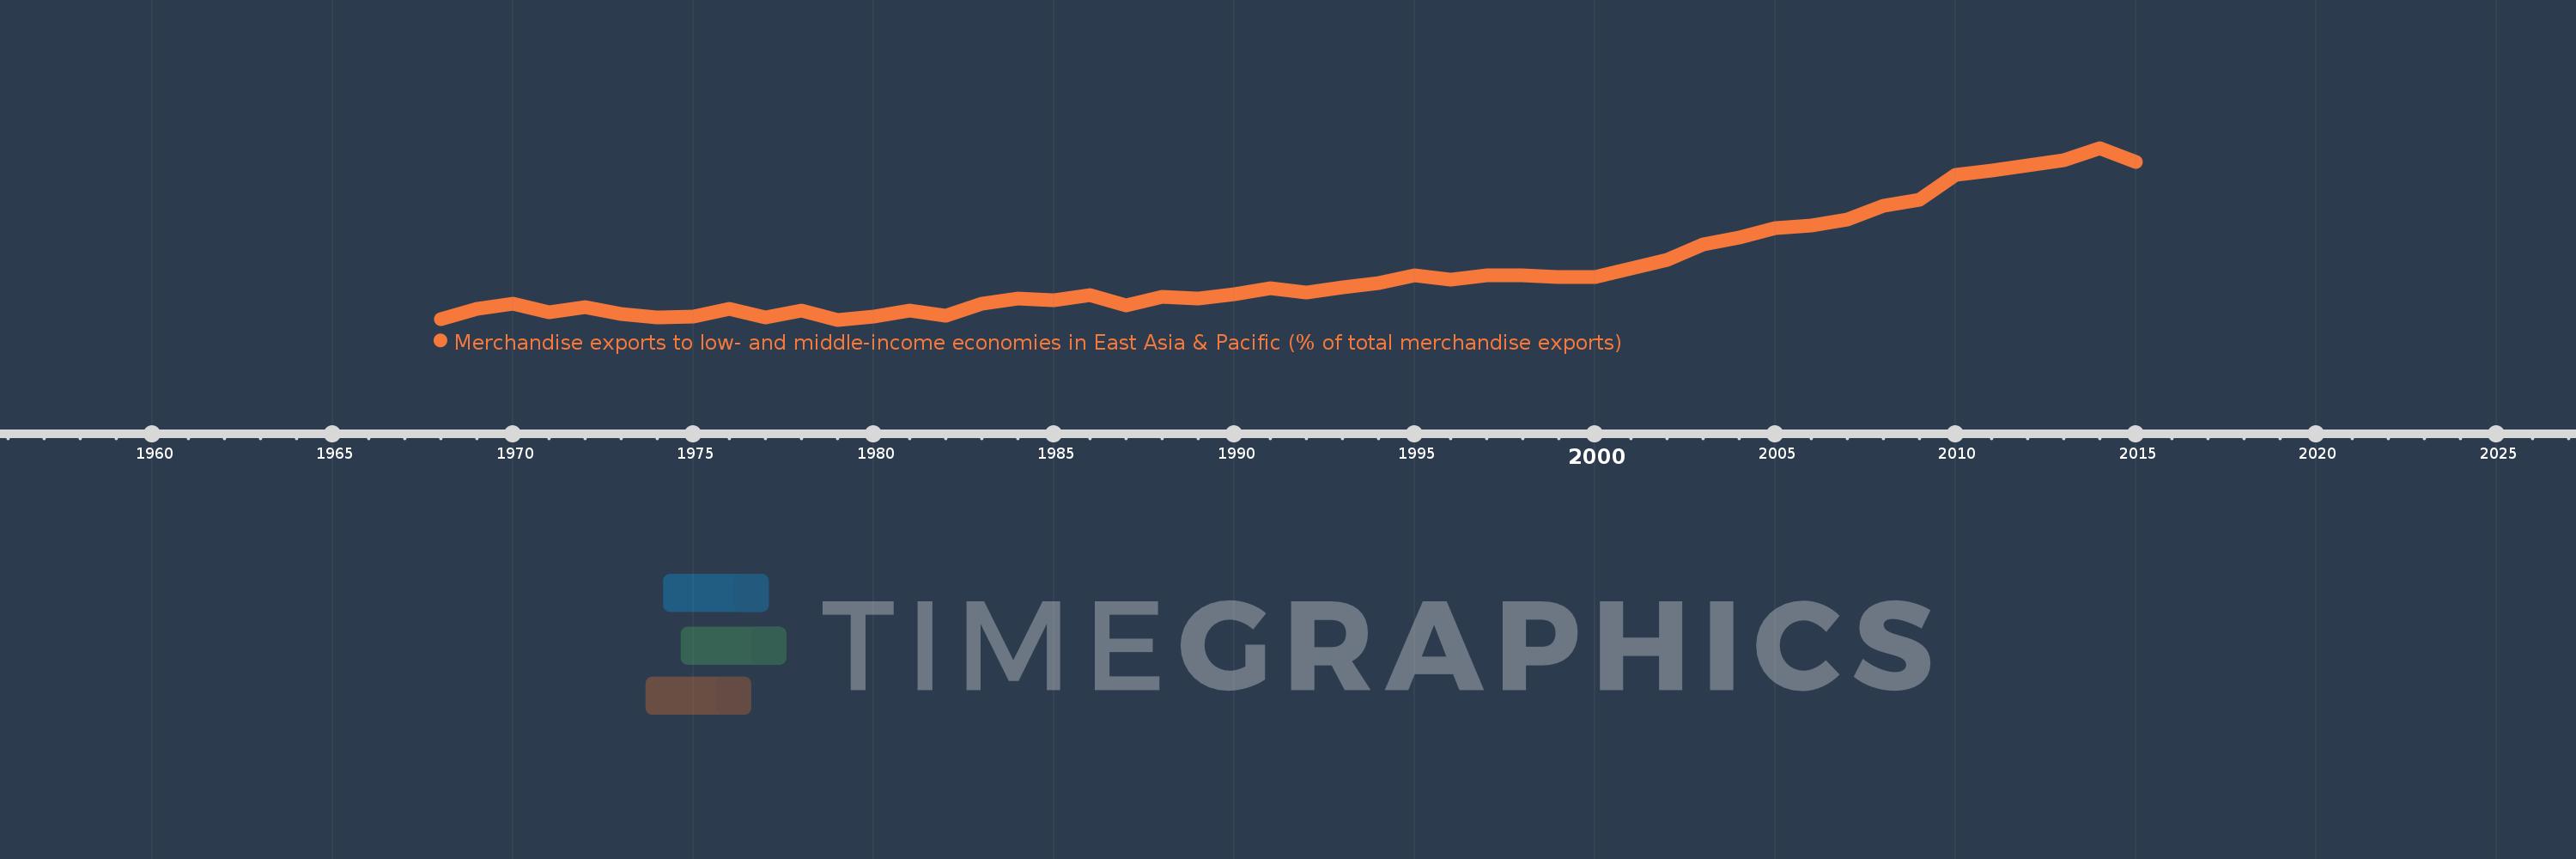
Merchandise exports to low- and middle-income economies in East Asia & Pacific (% of total merchandise exports)
2015,2014,2013,2012,2011,2010,2009,2008,2007,2006,2005,2004,2003,2002,2001,2000,1999,1998,1997,1996,1995,1994,1993,1992,1991,1990,1989,1988,1987,1986,1985,1984,1983,1982,1981,1980,1979,1978,1977,1976,1975,1974,1973,1972,1971,1970,1969,1968
This statistics in other country:
AfghanistanAlbaniaAlgeriaArab WorldArgentinaAustraliaAustriaAzerbaijanBahamas, TheBahrainBangladeshBarbadosBelarusBelgiumBermudaBrazilBrunei DarussalamBulgariaCabo VerdeCambodiaCameroonCanadaCaribbean small statesCentral Europe and the BalticsChileChinaColombiaCosta RicaCote d'IvoireCroatiaCubaCyprusCzech RepublicDenmarkDominicaDominican RepublicEarly-demographic dividendEast Asia & PacificEast Asia & Pacific (excluding high income)East Asia & Pacific (IDA & IBRD countries)EcuadorEgypt, Arab Rep.El SalvadorEstoniaEthiopiaEuro areaEurope & Central AsiaEurope & Central Asia (excluding high income)Europe & Central Asia (IDA & IBRD countries)European UnionFijiFinlandFragile and conflict affected situationsFranceGermanyGhanaGreeceGuatemalaGuyanaHeavily indebted poor countries (HIPC)High incomeHondurasHong Kong SAR, ChinaHungaryIBRD onlyIcelandIDA & IBRD totalIDA blendIDA onlyIDA totalIndiaIndonesiaIran, Islamic Rep.IraqIrelandIsraelItalyJamaicaJapanJordanKazakhstanKenyaKorea, Dem. People’s Rep.Korea, Rep.KuwaitLate-demographic dividendLatin America & Caribbean Latin America & Caribbean (excluding high income)Latin America & the Caribbean (IDA & IBRD countries)LatviaLeast developed countries: UN classificationLebanonLithuaniaLow & middle incomeLow incomeLower middle incomeLuxembourgMacao SAR, ChinaMacedonia, FYRMadagascarMalaysiaMaltaMauritiusMexicoMiddle East & North AfricaMiddle East & North Africa (excluding high income)Middle East & North Africa (IDA & IBRD countries)Middle incomeMoldovaMontenegroMoroccoMozambiqueMyanmarNetherlandsNew CaledoniaNew ZealandNigeriaNorth AmericaNorwayOECD membersOmanOther small statesPacific island small statesPakistanPapua New GuineaParaguayPeruPhilippinesPolandPortugalPost-demographic dividendPre-demographic dividendQatarRomaniaRussian FederationSaudi ArabiaSenegalSerbiaSingaporeSlovak RepublicSloveniaSmall statesSolomon IslandsSomaliaSouth AfricaSouth AsiaSouth Asia (IDA & IBRD)SpainSri LankaSt. LuciaSub-Saharan Africa Sub-Saharan Africa (excluding high income)Sub-Saharan Africa (IDA & IBRD countries)SurinameSwedenSwitzerlandSyrian Arab RepublicTanzaniaThailandTogoTongaTrinidad and TobagoTunisiaTurkeyUgandaUkraineUnited Arab EmiratesUnited KingdomUnited StatesUpper middle incomeVenezuela, RBVietnamWorldYemen, Rep.ZambiaZimbabwe Timeline:
This timeline shows a graph from 1968 to 2015 of Malaysia. No data until 1967. Number of actual observations by date: 48.
Source name:
World Development Indicators
Source organization:
World Bank staff estimates based data from International Monetary Fund's Direction of Trade database.
Categories, topics:
Private Sector, Trade
Last updated:
apr 23, 2017
Indicators value changes by year
Maximum:
27.583
jan 1, 2014
At the date of observation
Value
Absolute change
Change from previous value
jan 1, 1968
4.079
+4.079
0.0%
jan 1, 1969
5.535
+1.456
35.69%
jan 1, 1970
6.194
+0.659
11.91%
jan 1, 1971
5.045
-1.149
-18.55%
jan 1, 1972
5.805
+0.76
15.07%
jan 1, 1973
4.85
-0.955
-16.46%
jan 1, 1974
4.407
-0.443
-9.14%
jan 1, 1975
4.482
+0.075
1.69%
jan 1, 1976
5.478
+0.997
22.24%
jan 1, 1977
4.304
-1.174
-21.43%
jan 1, 1978
5.238
+0.933
21.69%
jan 1, 1979
4.036
-1.202
-22.95%
jan 1, 1980
4.433
+0.397
9.83%
jan 1, 1981
5.252
+0.82
18.49%
jan 1, 1982
4.641
-0.611
-11.63%
jan 1, 1983
6.196
+1.554
33.49%
jan 1, 1984
6.995
+0.799
12.9%
jan 1, 1985
6.759
-0.236
-3.37%
jan 1, 1986
7.426
+0.666
9.86%
jan 1, 1987
6.05
-1.376
-18.53%
jan 1, 1988
7.152
+1.102
18.22%
jan 1, 1989
6.929
-0.222
-3.11%
jan 1, 1990
7.503
+0.573
8.28%
jan 1, 1991
8.354
+0.851
11.35%
jan 1, 1992
7.726
-0.628
-7.52%
jan 1, 1993
8.431
+0.705
9.12%
jan 1, 1994
9.008
+0.578
6.85%
jan 1, 1995
10.137
+1.129
12.53%
jan 1, 1996
9.505
-0.633
-6.24%
jan 1, 1997
10.11
+0.605
6.37%
jan 1, 1998
10.075
-0.035
-0.34%
jan 1, 1999
9.852
-0.223
-2.22%
jan 1, 2000
9.856
+0.004
0.04%
jan 1, 2001
11.052
+1.196
12.13%
jan 1, 2002
12.261
+1.21
10.94%
jan 1, 2003
14.321
+2.06
16.8%
jan 1, 2004
15.335
+1.014
7.08%
jan 1, 2005
16.583
+1.248
8.14%
jan 1, 2006
16.909
+0.326
1.97%
jan 1, 2007
17.779
+0.87
5.15%
jan 1, 2008
19.716
+1.937
10.89%
jan 1, 2009
20.535
+0.819
4.16%
jan 1, 2010
23.846
+3.311
16.12%
jan 1, 2011
24.484
+0.638
2.67%
jan 1, 2012
25.161
+0.678
2.77%
jan 1, 2013
25.879
+0.718
2.85%
jan 1, 2014
27.583
+1.704
6.59%
jan 1, 2015
25.627
-1.956
-7.09%
Ranking of countries by current statistics by years


Comments: