29
/
en
AIzaSyAYiBZKx7MnpbEhh9jyipgxe19OcubqV5w
April 1, 2024
209546
New Zealand
NZL
true
2
1
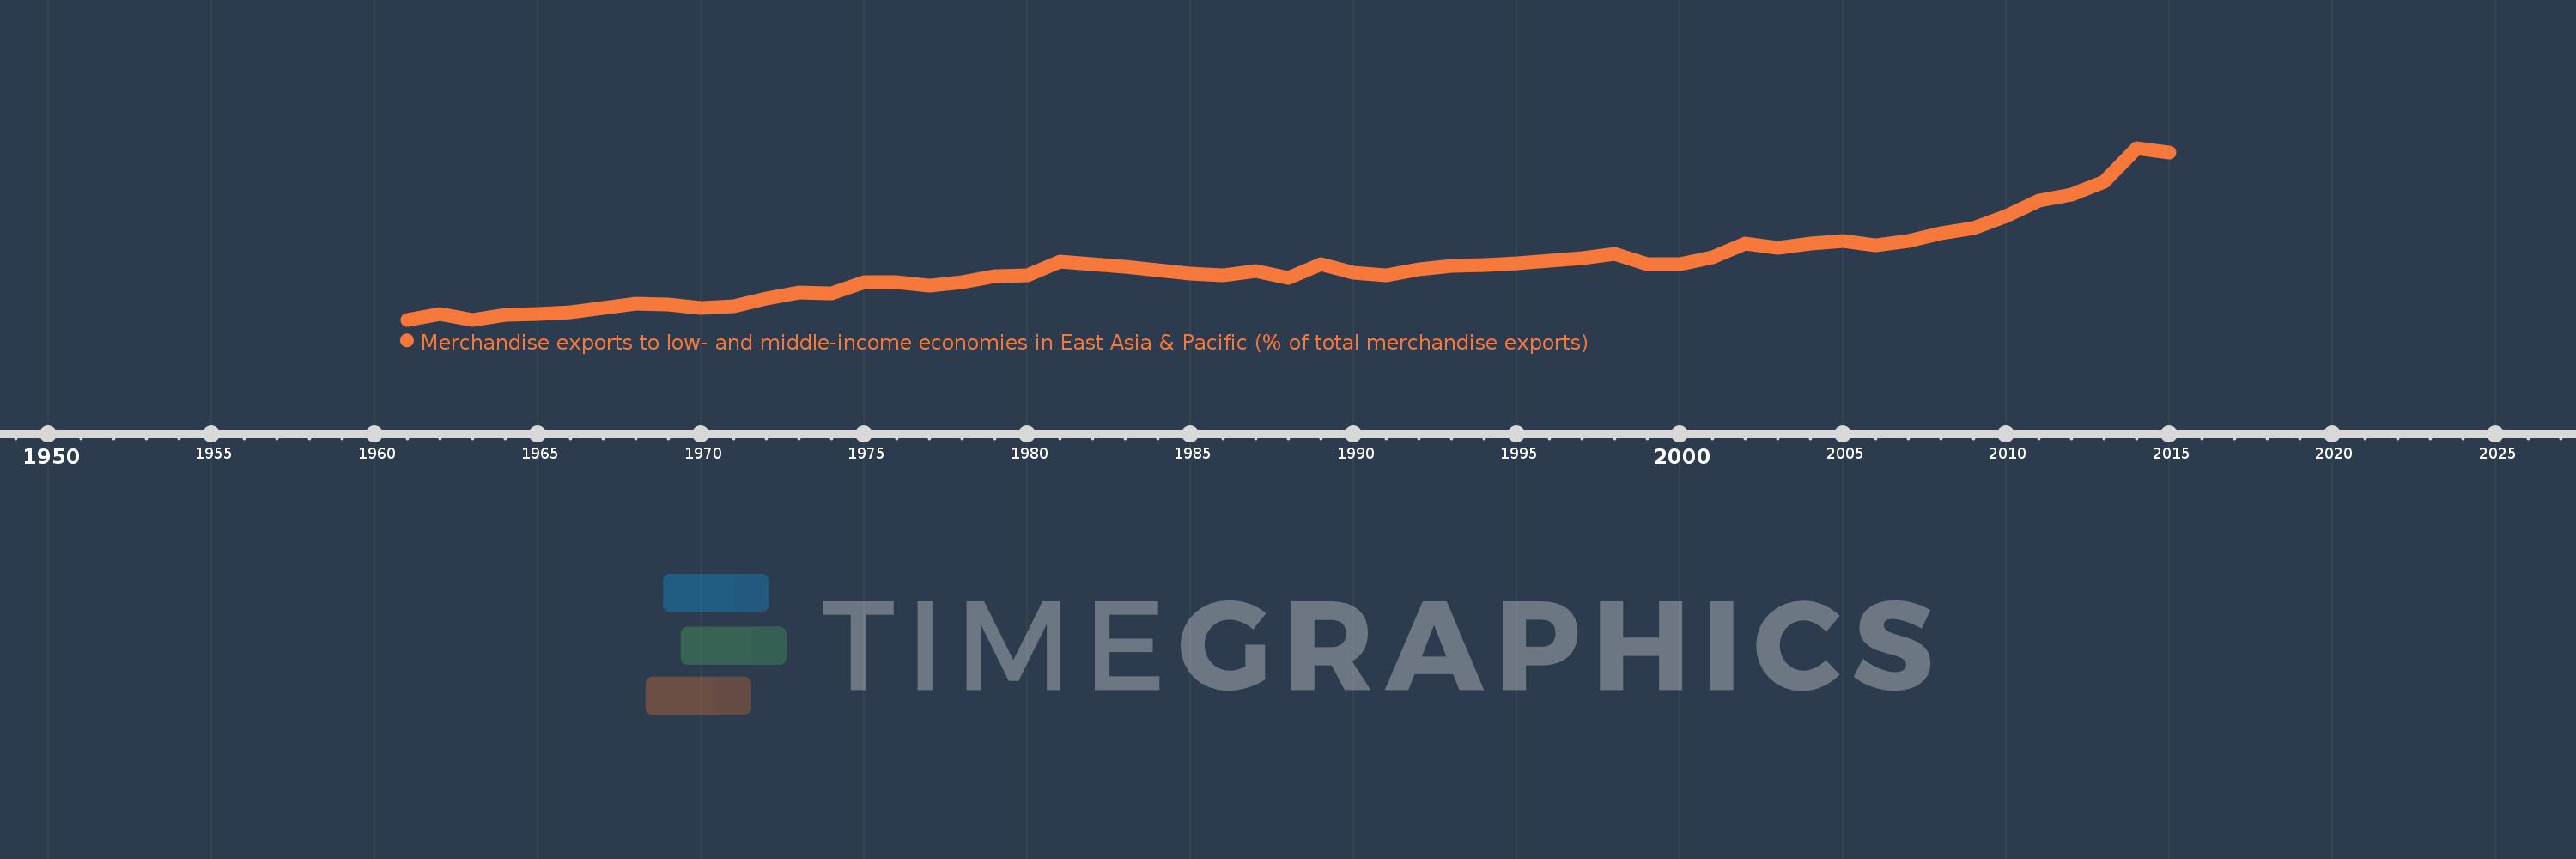
Merchandise exports to low- and middle-income economies in East Asia & Pacific (% of total merchandise exports)
2015,2014,2013,2012,2011,2010,2009,2008,2007,2006,2005,2004,2003,2002,2001,2000,1999,1998,1997,1996,1995,1994,1993,1992,1991,1990,1989,1988,1987,1986,1985,1984,1983,1982,1981,1980,1979,1978,1977,1976,1975,1974,1973,1972,1971,1970,1969,1968,1967,1966,1965,1964,1963,1962,1961
This statistics in other country:
AfghanistanAlbaniaAlgeriaArab WorldArgentinaAustraliaAustriaAzerbaijanBahamas, TheBahrainBangladeshBarbadosBelarusBelgiumBermudaBrazilBrunei DarussalamBulgariaCabo VerdeCambodiaCameroonCanadaCaribbean small statesCentral Europe and the BalticsChileChinaColombiaCosta RicaCote d'IvoireCroatiaCubaCyprusCzech RepublicDenmarkDominicaDominican RepublicEarly-demographic dividendEast Asia & PacificEast Asia & Pacific (excluding high income)East Asia & Pacific (IDA & IBRD countries)EcuadorEgypt, Arab Rep.El SalvadorEstoniaEthiopiaEuro areaEurope & Central AsiaEurope & Central Asia (excluding high income)Europe & Central Asia (IDA & IBRD countries)European UnionFijiFinlandFragile and conflict affected situationsFranceGermanyGhanaGreeceGuatemalaGuyanaHeavily indebted poor countries (HIPC)High incomeHondurasHong Kong SAR, ChinaHungaryIBRD onlyIcelandIDA & IBRD totalIDA blendIDA onlyIDA totalIndiaIndonesiaIran, Islamic Rep.IraqIrelandIsraelItalyJamaicaJapanJordanKazakhstanKenyaKorea, Dem. People’s Rep.Korea, Rep.KuwaitLate-demographic dividendLatin America & Caribbean Latin America & Caribbean (excluding high income)Latin America & the Caribbean (IDA & IBRD countries)LatviaLeast developed countries: UN classificationLebanonLithuaniaLow & middle incomeLow incomeLower middle incomeLuxembourgMacao SAR, ChinaMacedonia, FYRMadagascarMalaysiaMaltaMauritiusMexicoMiddle East & North AfricaMiddle East & North Africa (excluding high income)Middle East & North Africa (IDA & IBRD countries)Middle incomeMoldovaMontenegroMoroccoMozambiqueMyanmarNetherlandsNew CaledoniaNew ZealandNigeriaNorth AmericaNorwayOECD membersOmanOther small statesPacific island small statesPakistanPapua New GuineaParaguayPeruPhilippinesPolandPortugalPost-demographic dividendPre-demographic dividendQatarRomaniaRussian FederationSaudi ArabiaSenegalSerbiaSingaporeSlovak RepublicSloveniaSmall statesSolomon IslandsSomaliaSouth AfricaSouth AsiaSouth Asia (IDA & IBRD)SpainSri LankaSt. LuciaSub-Saharan Africa Sub-Saharan Africa (excluding high income)Sub-Saharan Africa (IDA & IBRD countries)SurinameSwedenSwitzerlandSyrian Arab RepublicTanzaniaThailandTogoTongaTrinidad and TobagoTunisiaTurkeyUgandaUkraineUnited Arab EmiratesUnited KingdomUnited StatesUpper middle incomeVenezuela, RBVietnamWorldYemen, Rep.ZambiaZimbabwe Timeline:
This timeline shows a graph from 1961 to 2015 of New Zealand. No data until 1960. Number of actual observations by date: 55.
Source name:
World Development Indicators
Source organization:
World Bank staff estimates based data from International Monetary Fund's Direction of Trade database.
Categories, topics:
Private Sector, Trade
Last updated:
apr 23, 2017
Indicators value changes by year
At the date of observation
Value
Absolute change
Change from previous value
jan 1, 1961
0.627
+0.627
0.0%
jan 1, 1962
1.567
+0.939
149.75%
jan 1, 1963
0.649
-0.918
-58.58%
jan 1, 1964
1.437
+0.788
121.41%
jan 1, 1965
1.621
+0.184
12.8%
jan 1, 1966
1.959
+0.338
20.86%
jan 1, 1967
2.638
+0.679
34.68%
jan 1, 1968
3.467
+0.829
31.41%
jan 1, 1969
3.209
-0.258
-7.45%
jan 1, 1970
2.683
-0.525
-16.37%
jan 1, 1971
3.028
+0.345
12.86%
jan 1, 1972
4.323
+1.295
42.75%
jan 1, 1973
5.353
+1.03
23.83%
jan 1, 1974
5.144
-0.209
-3.91%
jan 1, 1975
7.092
+1.948
37.87%
jan 1, 1976
7.162
+0.07
0.98%
jan 1, 1977
6.6
-0.562
-7.85%
jan 1, 1978
7.171
+0.571
8.66%
jan 1, 1979
8.241
+1.07
14.92%
jan 1, 1980
8.326
+0.085
1.03%
jan 1, 1981
10.728
+2.402
28.85%
jan 1, 1982
10.245
-0.483
-4.5%
jan 1, 1983
9.758
-0.487
-4.76%
jan 1, 1984
9.272
-0.486
-4.98%
jan 1, 1985
8.575
-0.697
-7.52%
jan 1, 1986
8.396
-0.179
-2.09%
jan 1, 1987
9.055
+0.66
7.86%
jan 1, 1988
7.893
-1.162
-12.83%
jan 1, 1989
10.238
+2.345
29.71%
jan 1, 1990
8.807
-1.431
-13.98%
jan 1, 1991
8.296
-0.511
-5.8%
jan 1, 1992
9.43
+1.134
13.67%
jan 1, 1993
9.944
+0.513
5.45%
jan 1, 1994
10.188
+0.244
2.45%
jan 1, 1995
10.405
+0.218
2.14%
jan 1, 1996
10.82
+0.414
3.98%
jan 1, 1997
11.391
+0.571
5.28%
jan 1, 1998
11.995
+0.605
5.31%
jan 1, 1999
10.23
-1.766
-14.72%
jan 1, 2000
10.276
+0.046
0.45%
jan 1, 2001
11.417
+1.141
11.1%
jan 1, 2002
13.908
+2.491
21.82%
jan 1, 2003
13.161
-0.748
-5.38%
jan 1, 2004
13.925
+0.764
5.8%
jan 1, 2005
14.298
+0.374
2.68%
jan 1, 2006
13.585
-0.713
-4.99%
jan 1, 2007
14.266
+0.681
5.01%
jan 1, 2008
15.621
+1.356
9.5%
jan 1, 2009
16.563
+0.942
6.03%
jan 1, 2010
18.694
+2.13
12.86%
jan 1, 2011
21.236
+2.542
13.6%
jan 1, 2012
22.332
+1.097
5.16%
jan 1, 2013
24.603
+2.271
10.17%
jan 1, 2014
30.45
+5.846
23.76%
jan 1, 2015
29.717
-0.732
-2.41%
Ranking of countries by current statistics by years


Comments: