29
/
en
AIzaSyAYiBZKx7MnpbEhh9jyipgxe19OcubqV5w
April 1, 2024
153783
Iceland
ISL
true
2
1
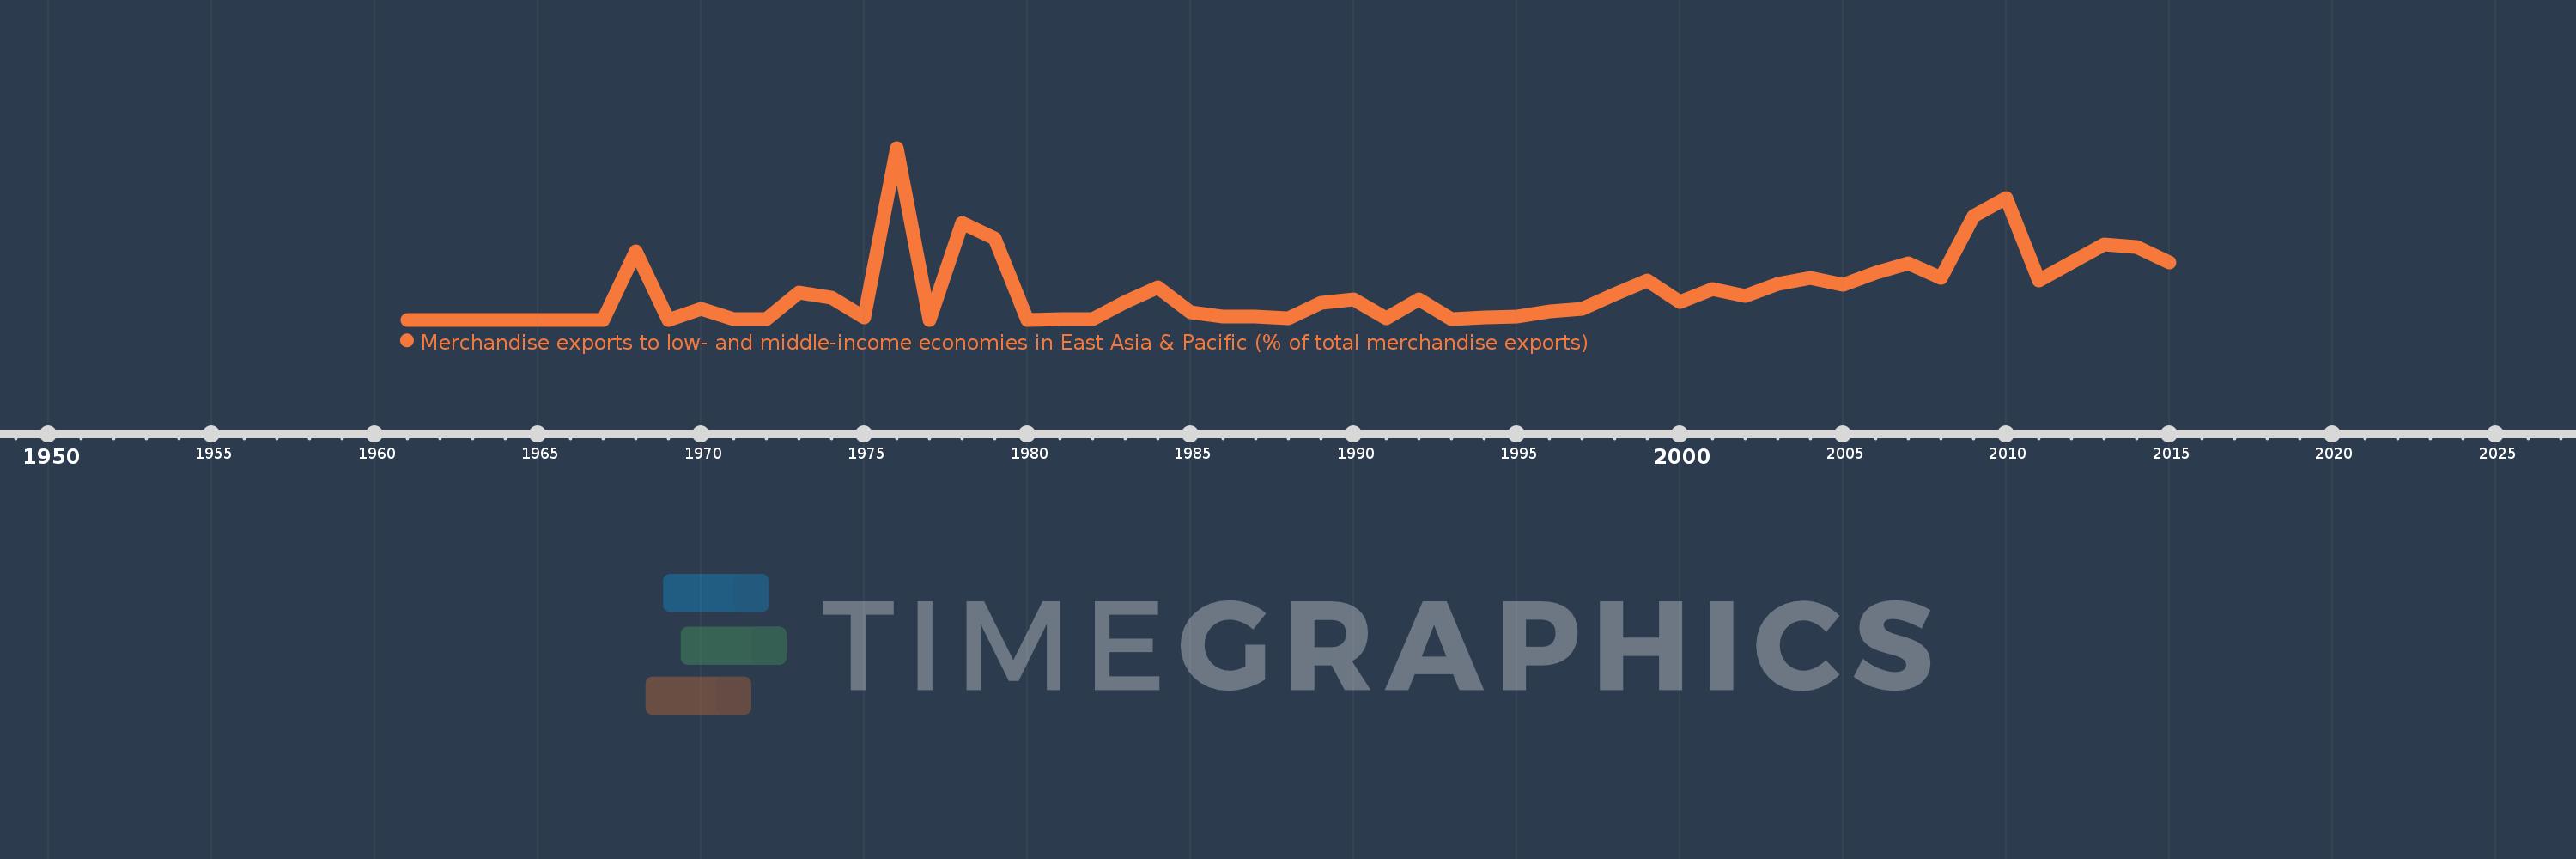
Merchandise exports to low- and middle-income economies in East Asia & Pacific (% of total merchandise exports)
2015,2014,2013,2012,2011,2010,2009,2008,2007,2006,2005,2004,2003,2002,2001,2000,1999,1998,1997,1996,1995,1994,1993,1992,1991,1990,1989,1988,1987,1986,1985,1984,1983,1982,1981,1980,1979,1978,1977,1976,1975,1974,1973,1972,1971,1970,1969,1968,1967,1966,1965,1964,1963,1962,1961
This statistics in other country:
AfghanistanAlbaniaAlgeriaArab WorldArgentinaAustraliaAustriaAzerbaijanBahamas, TheBahrainBangladeshBarbadosBelarusBelgiumBermudaBrazilBrunei DarussalamBulgariaCabo VerdeCambodiaCameroonCanadaCaribbean small statesCentral Europe and the BalticsChileChinaColombiaCosta RicaCote d'IvoireCroatiaCubaCyprusCzech RepublicDenmarkDominicaDominican RepublicEarly-demographic dividendEast Asia & PacificEast Asia & Pacific (excluding high income)East Asia & Pacific (IDA & IBRD countries)EcuadorEgypt, Arab Rep.El SalvadorEstoniaEthiopiaEuro areaEurope & Central AsiaEurope & Central Asia (excluding high income)Europe & Central Asia (IDA & IBRD countries)European UnionFijiFinlandFragile and conflict affected situationsFranceGermanyGhanaGreeceGuatemalaGuyanaHeavily indebted poor countries (HIPC)High incomeHondurasHong Kong SAR, ChinaHungaryIBRD onlyIcelandIDA & IBRD totalIDA blendIDA onlyIDA totalIndiaIndonesiaIran, Islamic Rep.IraqIrelandIsraelItalyJamaicaJapanJordanKazakhstanKenyaKorea, Dem. People’s Rep.Korea, Rep.KuwaitLate-demographic dividendLatin America & Caribbean Latin America & Caribbean (excluding high income)Latin America & the Caribbean (IDA & IBRD countries)LatviaLeast developed countries: UN classificationLebanonLithuaniaLow & middle incomeLow incomeLower middle incomeLuxembourgMacao SAR, ChinaMacedonia, FYRMadagascarMalaysiaMaltaMauritiusMexicoMiddle East & North AfricaMiddle East & North Africa (excluding high income)Middle East & North Africa (IDA & IBRD countries)Middle incomeMoldovaMontenegroMoroccoMozambiqueMyanmarNetherlandsNew CaledoniaNew ZealandNigeriaNorth AmericaNorwayOECD membersOmanOther small statesPacific island small statesPakistanPapua New GuineaParaguayPeruPhilippinesPolandPortugalPost-demographic dividendPre-demographic dividendQatarRomaniaRussian FederationSaudi ArabiaSenegalSerbiaSingaporeSlovak RepublicSloveniaSmall statesSolomon IslandsSomaliaSouth AfricaSouth AsiaSouth Asia (IDA & IBRD)SpainSri LankaSt. LuciaSub-Saharan Africa Sub-Saharan Africa (excluding high income)Sub-Saharan Africa (IDA & IBRD countries)SurinameSwedenSwitzerlandSyrian Arab RepublicTanzaniaThailandTogoTongaTrinidad and TobagoTunisiaTurkeyUgandaUkraineUnited Arab EmiratesUnited KingdomUnited StatesUpper middle incomeVenezuela, RBVietnamWorldYemen, Rep.ZambiaZimbabwe Timeline:
This timeline shows a graph from 1961 to 2015 of Iceland. No data until 1960. Number of actual observations by date: 55.
Source name:
World Development Indicators
Source organization:
World Bank staff estimates based data from International Monetary Fund's Direction of Trade database.
Categories, topics:
Private Sector, Trade
Last updated:
apr 23, 2017
Indicators value changes by year
At the date of observation
Value
Absolute change
Change from previous value
jan 1, 1968
1.455
+1.455
%
jan 1, 1969
0.0
-1.455
-100.0%
jan 1, 1970
0.225
+0.225
%
jan 1, 1971
0.013
-0.212
-94.26%
jan 1, 1972
0.014
+0.001
8.64%
jan 1, 1973
0.585
+0.571
4.07K%
jan 1, 1974
0.476
-0.11
-18.73%
jan 1, 1975
0.048
-0.428
-89.97%
jan 1, 1976
3.651
+3.604
7.56K%
jan 1, 1977
0.002
-3.65
-99.95%
jan 1, 1978
2.051
+2.049
117.2K%
jan 1, 1979
1.72
-0.33
-16.11%
jan 1, 1980
0.002
-1.718
-99.88%
jan 1, 1981
0.006
+0.004
187.4%
jan 1, 1982
0.016
+0.01
173.36%
jan 1, 1983
0.372
+0.356
2.21K%
jan 1, 1984
0.696
+0.324
87.2%
jan 1, 1985
0.157
-0.539
-77.41%
jan 1, 1986
0.073
-0.085
-53.78%
jan 1, 1987
0.059
-0.014
-18.88%
jan 1, 1988
0.031
-0.028
-47.56%
jan 1, 1989
0.358
+0.327
1.06K%
jan 1, 1990
0.436
+0.077
21.56%
jan 1, 1991
0.028
-0.408
-93.59%
jan 1, 1992
0.433
+0.405
1.45K%
jan 1, 1993
0.019
-0.414
-95.57%
jan 1, 1994
0.045
+0.026
134.35%
jan 1, 1995
0.069
+0.025
54.49%
jan 1, 1996
0.173
+0.104
149.64%
jan 1, 1997
0.226
+0.053
30.44%
jan 1, 1998
0.551
+0.324
143.33%
jan 1, 1999
0.839
+0.288
52.3%
jan 1, 2000
0.385
-0.454
-54.15%
jan 1, 2001
0.659
+0.274
71.31%
jan 1, 2002
0.508
-0.151
-22.88%
jan 1, 2003
0.758
+0.25
49.21%
jan 1, 2004
0.88
+0.122
16.08%
jan 1, 2005
0.734
-0.146
-16.63%
jan 1, 2006
0.998
+0.264
36.02%
jan 1, 2007
1.192
+0.194
19.47%
jan 1, 2008
0.881
-0.311
-26.09%
jan 1, 2009
2.206
+1.325
150.37%
jan 1, 2010
2.586
+0.38
17.22%
jan 1, 2011
0.838
-1.747
-67.58%
jan 1, 2012
1.216
+0.378
45.09%
jan 1, 2013
1.594
+0.378
31.05%
jan 1, 2014
1.555
-0.039
-2.44%
jan 1, 2015
1.215
-0.341
-21.9%
Ranking of countries by current statistics by years


Comments: