29
/
en
AIzaSyAYiBZKx7MnpbEhh9jyipgxe19OcubqV5w
April 1, 2024
38340
IDA blend
IDB
false
2
1
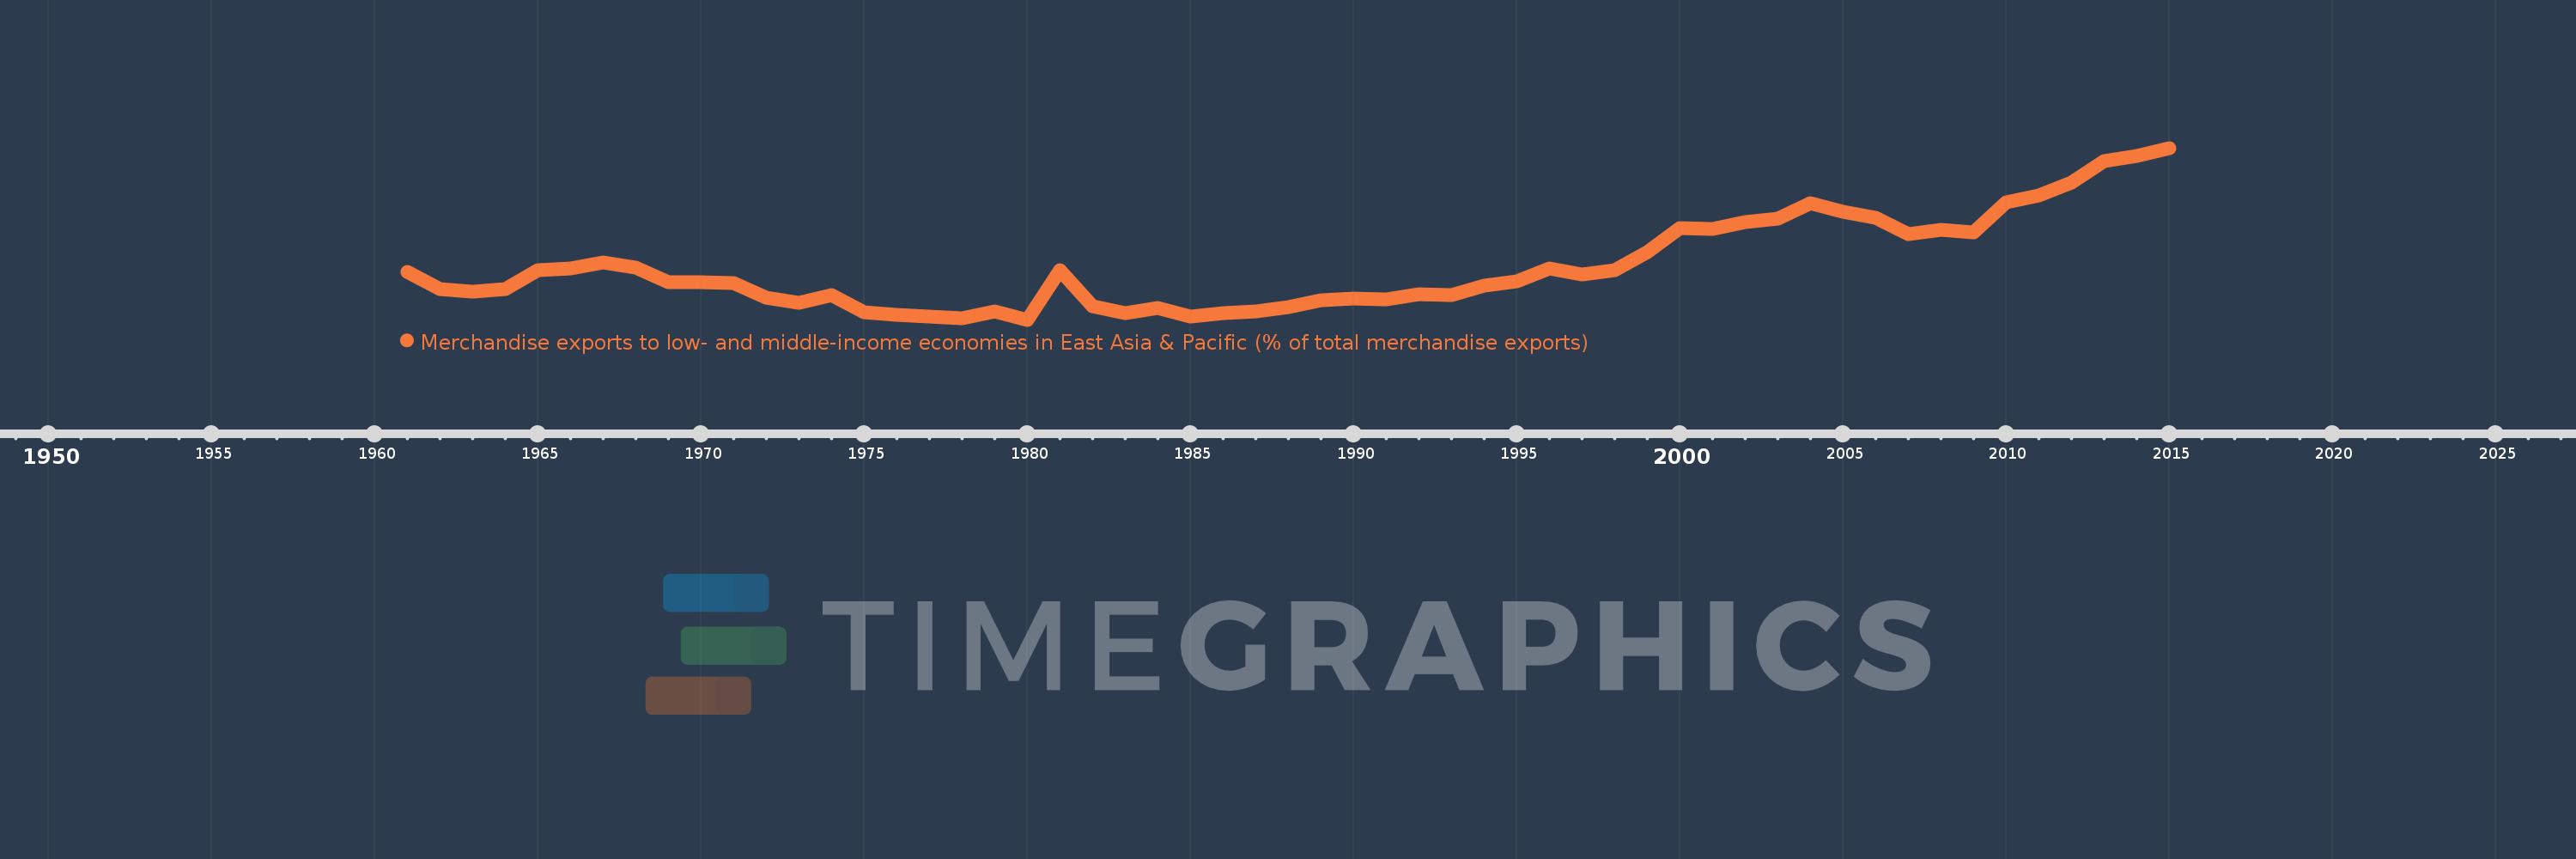
Merchandise exports to low- and middle-income economies in East Asia & Pacific (% of total merchandise exports)
2015,2014,2013,2012,2011,2010,2009,2008,2007,2006,2005,2004,2003,2002,2001,2000,1999,1998,1997,1996,1995,1994,1993,1992,1991,1990,1989,1988,1987,1986,1985,1984,1983,1982,1981,1980,1979,1978,1977,1976,1975,1974,1973,1972,1971,1970,1969,1968,1967,1966,1965,1964,1963,1962,1961
This statistics in other country:
AfghanistanAlbaniaAlgeriaArab WorldArgentinaAustraliaAustriaAzerbaijanBahamas, TheBahrainBangladeshBarbadosBelarusBelgiumBermudaBrazilBrunei DarussalamBulgariaCabo VerdeCambodiaCameroonCanadaCaribbean small statesCentral Europe and the BalticsChileChinaColombiaCosta RicaCote d'IvoireCroatiaCubaCyprusCzech RepublicDenmarkDominicaDominican RepublicEarly-demographic dividendEast Asia & PacificEast Asia & Pacific (excluding high income)East Asia & Pacific (IDA & IBRD countries)EcuadorEgypt, Arab Rep.El SalvadorEstoniaEthiopiaEuro areaEurope & Central AsiaEurope & Central Asia (excluding high income)Europe & Central Asia (IDA & IBRD countries)European UnionFijiFinlandFragile and conflict affected situationsFranceGermanyGhanaGreeceGuatemalaGuyanaHeavily indebted poor countries (HIPC)High incomeHondurasHong Kong SAR, ChinaHungaryIBRD onlyIcelandIDA & IBRD totalIDA blendIDA onlyIDA totalIndiaIndonesiaIran, Islamic Rep.IraqIrelandIsraelItalyJamaicaJapanJordanKazakhstanKenyaKorea, Dem. People’s Rep.Korea, Rep.KuwaitLate-demographic dividendLatin America & Caribbean Latin America & Caribbean (excluding high income)Latin America & the Caribbean (IDA & IBRD countries)LatviaLeast developed countries: UN classificationLebanonLithuaniaLow & middle incomeLow incomeLower middle incomeLuxembourgMacao SAR, ChinaMacedonia, FYRMadagascarMalaysiaMaltaMauritiusMexicoMiddle East & North AfricaMiddle East & North Africa (excluding high income)Middle East & North Africa (IDA & IBRD countries)Middle incomeMoldovaMontenegroMoroccoMozambiqueMyanmarNetherlandsNew CaledoniaNew ZealandNigeriaNorth AmericaNorwayOECD membersOmanOther small statesPacific island small statesPakistanPapua New GuineaParaguayPeruPhilippinesPolandPortugalPost-demographic dividendPre-demographic dividendQatarRomaniaRussian FederationSaudi ArabiaSenegalSerbiaSingaporeSlovak RepublicSloveniaSmall statesSolomon IslandsSomaliaSouth AfricaSouth AsiaSouth Asia (IDA & IBRD)SpainSri LankaSt. LuciaSub-Saharan Africa Sub-Saharan Africa (excluding high income)Sub-Saharan Africa (IDA & IBRD countries)SurinameSwedenSwitzerlandSyrian Arab RepublicTanzaniaThailandTogoTongaTrinidad and TobagoTunisiaTurkeyUgandaUkraineUnited Arab EmiratesUnited KingdomUnited StatesUpper middle incomeVenezuela, RBVietnamWorldYemen, Rep.ZambiaZimbabwe Timeline:
This timeline shows a graph from 1961 to 2015 of IDA blend. No data until 1960. Number of actual observations by date: 55.
Source name:
World Development Indicators
Source organization:
World Bank staff estimates based data from International Monetary Fund's Direction of Trade database.
Categories, topics:
Private Sector, Trade
Last updated:
apr 23, 2017
Indicators value changes by year
Maximum:
13.486
jan 1, 2015
At the date of observation
Value
Absolute change
Change from previous value
jan 1, 1961
4.196
+4.196
0.0%
jan 1, 1962
2.889
-1.306
-31.13%
jan 1, 1963
2.725
-0.164
-5.69%
jan 1, 1964
2.888
+0.163
5.99%
jan 1, 1965
4.345
+1.457
50.44%
jan 1, 1966
4.451
+0.106
2.44%
jan 1, 1967
4.925
+0.473
10.63%
jan 1, 1968
4.504
-0.42
-8.53%
jan 1, 1969
3.455
-1.049
-23.3%
jan 1, 1970
3.407
-0.048
-1.4%
jan 1, 1971
3.367
-0.04
-1.17%
jan 1, 1972
2.256
-1.111
-32.99%
jan 1, 1973
1.874
-0.382
-16.92%
jan 1, 1974
2.453
+0.579
30.86%
jan 1, 1975
1.181
-1.272
-51.87%
jan 1, 1976
0.997
-0.184
-15.6%
jan 1, 1977
0.825
-0.171
-17.2%
jan 1, 1978
0.752
-0.073
-8.85%
jan 1, 1979
1.214
+0.462
61.42%
jan 1, 1980
0.617
-0.597
-49.16%
jan 1, 1981
4.335
+3.718
602.43%
jan 1, 1982
1.627
-2.708
-62.47%
jan 1, 1983
1.118
-0.509
-31.31%
jan 1, 1984
1.49
+0.373
33.34%
jan 1, 1985
0.831
-0.659
-44.22%
jan 1, 1986
1.095
+0.263
31.67%
jan 1, 1987
1.269
+0.175
15.98%
jan 1, 1988
1.541
+0.272
21.4%
jan 1, 1989
2.107
+0.566
36.73%
jan 1, 1990
2.233
+0.126
5.98%
jan 1, 1991
2.138
-0.095
-4.25%
jan 1, 1992
2.5
+0.362
16.92%
jan 1, 1993
2.49
-0.01
-0.4%
jan 1, 1994
3.172
+0.682
27.4%
jan 1, 1995
3.492
+0.32
10.08%
jan 1, 1996
4.439
+0.947
27.11%
jan 1, 1997
3.992
-0.447
-10.08%
jan 1, 1998
4.357
+0.365
9.15%
jan 1, 1999
5.681
+1.324
30.39%
jan 1, 2000
7.513
+1.832
32.25%
jan 1, 2001
7.406
-0.106
-1.41%
jan 1, 2002
7.959
+0.553
7.47%
jan 1, 2003
8.176
+0.216
2.72%
jan 1, 2004
9.318
+1.142
13.97%
jan 1, 2005
8.72
-0.598
-6.42%
jan 1, 2006
8.271
-0.448
-5.14%
jan 1, 2007
7.002
-1.269
-15.34%
jan 1, 2008
7.348
+0.345
4.93%
jan 1, 2009
7.145
-0.202
-2.75%
jan 1, 2010
9.438
+2.292
32.08%
jan 1, 2011
9.952
+0.514
5.45%
jan 1, 2012
10.909
+0.958
9.62%
jan 1, 2013
12.523
+1.614
14.79%
jan 1, 2014
12.904
+0.381
3.04%
jan 1, 2015
13.486
+0.582
4.51%
Ranking of countries by current statistics by years


Comments: