29
/
en
AIzaSyAYiBZKx7MnpbEhh9jyipgxe19OcubqV5w
April 1, 2024
249004
Sri Lanka
LKA
true
2
1
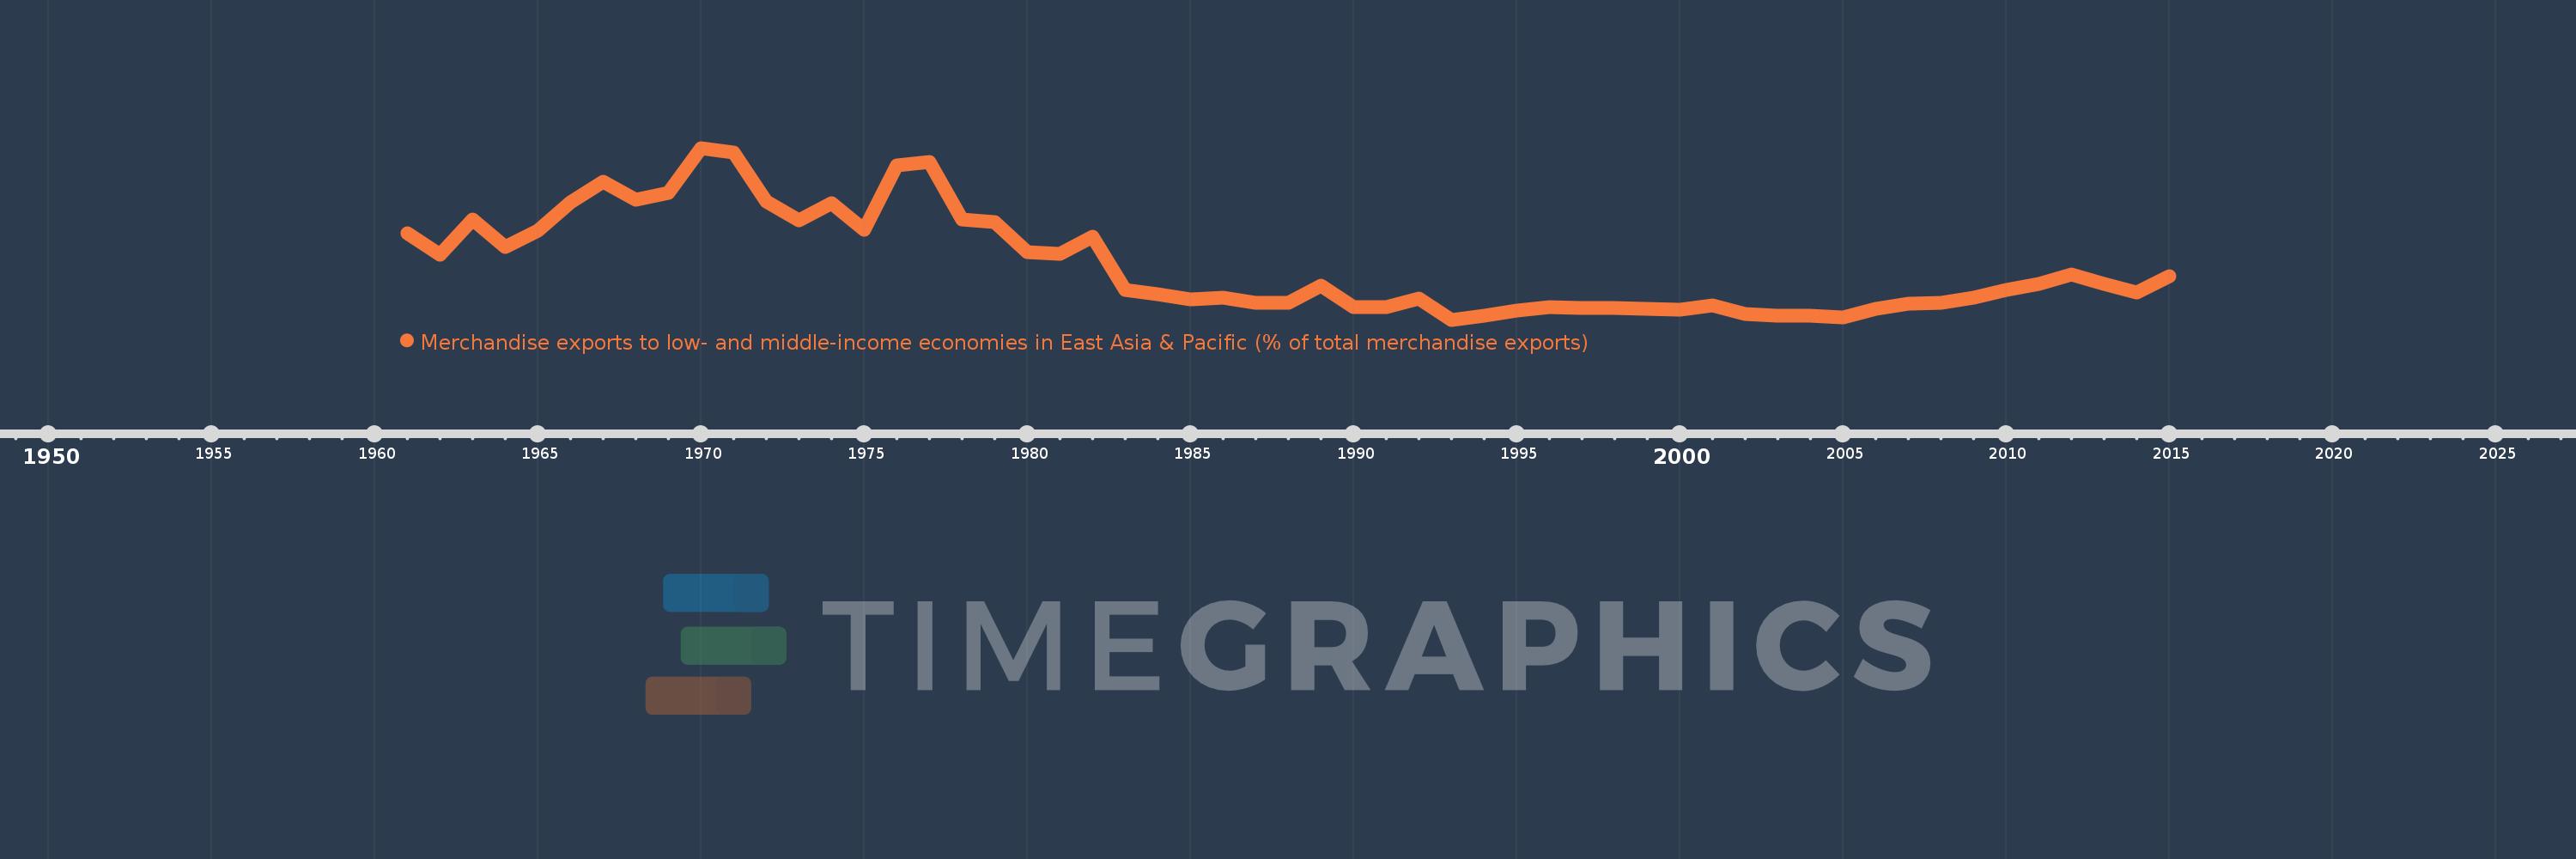
Merchandise exports to low- and middle-income economies in East Asia & Pacific (% of total merchandise exports)
2015,2014,2013,2012,2011,2010,2009,2008,2007,2006,2005,2004,2003,2002,2001,2000,1999,1998,1997,1996,1995,1994,1993,1992,1991,1990,1989,1988,1987,1986,1985,1984,1983,1982,1981,1980,1979,1978,1977,1976,1975,1974,1973,1972,1971,1970,1969,1968,1967,1966,1965,1964,1963,1962,1961
This statistics in other country:
AfghanistanAlbaniaAlgeriaArab WorldArgentinaAustraliaAustriaAzerbaijanBahamas, TheBahrainBangladeshBarbadosBelarusBelgiumBermudaBrazilBrunei DarussalamBulgariaCabo VerdeCambodiaCameroonCanadaCaribbean small statesCentral Europe and the BalticsChileChinaColombiaCosta RicaCote d'IvoireCroatiaCubaCyprusCzech RepublicDenmarkDominicaDominican RepublicEarly-demographic dividendEast Asia & PacificEast Asia & Pacific (excluding high income)East Asia & Pacific (IDA & IBRD countries)EcuadorEgypt, Arab Rep.El SalvadorEstoniaEthiopiaEuro areaEurope & Central AsiaEurope & Central Asia (excluding high income)Europe & Central Asia (IDA & IBRD countries)European UnionFijiFinlandFragile and conflict affected situationsFranceGermanyGhanaGreeceGuatemalaGuyanaHeavily indebted poor countries (HIPC)High incomeHondurasHong Kong SAR, ChinaHungaryIBRD onlyIcelandIDA & IBRD totalIDA blendIDA onlyIDA totalIndiaIndonesiaIran, Islamic Rep.IraqIrelandIsraelItalyJamaicaJapanJordanKazakhstanKenyaKorea, Dem. People’s Rep.Korea, Rep.KuwaitLate-demographic dividendLatin America & Caribbean Latin America & Caribbean (excluding high income)Latin America & the Caribbean (IDA & IBRD countries)LatviaLeast developed countries: UN classificationLebanonLithuaniaLow & middle incomeLow incomeLower middle incomeLuxembourgMacao SAR, ChinaMacedonia, FYRMadagascarMalaysiaMaltaMauritiusMexicoMiddle East & North AfricaMiddle East & North Africa (excluding high income)Middle East & North Africa (IDA & IBRD countries)Middle incomeMoldovaMontenegroMoroccoMozambiqueMyanmarNetherlandsNew CaledoniaNew ZealandNigeriaNorth AmericaNorwayOECD membersOmanOther small statesPacific island small statesPakistanPapua New GuineaParaguayPeruPhilippinesPolandPortugalPost-demographic dividendPre-demographic dividendQatarRomaniaRussian FederationSaudi ArabiaSenegalSerbiaSingaporeSlovak RepublicSloveniaSmall statesSolomon IslandsSomaliaSouth AfricaSouth AsiaSouth Asia (IDA & IBRD)SpainSri LankaSt. LuciaSub-Saharan Africa Sub-Saharan Africa (excluding high income)Sub-Saharan Africa (IDA & IBRD countries)SurinameSwedenSwitzerlandSyrian Arab RepublicTanzaniaThailandTogoTongaTrinidad and TobagoTunisiaTurkeyUgandaUkraineUnited Arab EmiratesUnited KingdomUnited StatesUpper middle incomeVenezuela, RBVietnamWorldYemen, Rep.ZambiaZimbabwe Timeline:
This timeline shows a graph from 1961 to 2015 of Sri Lanka. No data until 1960. Number of actual observations by date: 55.
Source name:
World Development Indicators
Source organization:
World Bank staff estimates based data from International Monetary Fund's Direction of Trade database.
Categories, topics:
Private Sector, Trade
Last updated:
apr 23, 2017
Indicators value changes by year
Maximum:
13.173
jan 1, 1970
At the date of observation
Value
Absolute change
Change from previous value
jan 1, 1961
7.166
+7.166
0.0%
jan 1, 1962
5.609
-1.557
-21.73%
jan 1, 1963
8.122
+2.513
44.8%
jan 1, 1964
6.17
-1.952
-24.04%
jan 1, 1965
7.338
+1.168
18.94%
jan 1, 1966
9.311
+1.973
26.89%
jan 1, 1967
10.776
+1.465
15.73%
jan 1, 1968
9.531
-1.245
-11.56%
jan 1, 1969
10.024
+0.493
5.18%
jan 1, 1970
13.173
+3.149
31.42%
jan 1, 1971
12.831
-0.343
-2.6%
jan 1, 1972
9.383
-3.448
-26.87%
jan 1, 1973
8.033
-1.35
-14.39%
jan 1, 1974
9.266
+1.234
15.36%
jan 1, 1975
7.376
-1.89
-20.4%
jan 1, 1976
11.965
+4.589
62.21%
jan 1, 1977
12.184
+0.219
1.83%
jan 1, 1978
8.093
-4.091
-33.58%
jan 1, 1979
7.908
-0.184
-2.28%
jan 1, 1980
5.838
-2.07
-26.18%
jan 1, 1981
5.714
-0.124
-2.12%
jan 1, 1982
6.933
+1.219
21.33%
jan 1, 1983
3.169
-3.764
-54.28%
jan 1, 1984
2.822
-0.347
-10.96%
jan 1, 1985
2.497
-0.325
-11.51%
jan 1, 1986
2.614
+0.116
4.66%
jan 1, 1987
2.245
-0.369
-14.13%
jan 1, 1988
2.22
-0.025
-1.1%
jan 1, 1989
3.424
+1.204
54.25%
jan 1, 1990
1.934
-1.489
-43.5%
jan 1, 1991
1.94
+0.006
0.3%
jan 1, 1992
2.51
+0.569
29.35%
jan 1, 1993
1.041
-1.469
-58.52%
jan 1, 1994
1.34
+0.299
28.72%
jan 1, 1995
1.688
+0.348
25.96%
jan 1, 1996
1.921
+0.233
13.77%
jan 1, 1997
1.859
-0.062
-3.22%
jan 1, 1998
1.901
+0.042
2.28%
jan 1, 1999
1.801
-0.1
-5.26%
jan 1, 2000
1.775
-0.026
-1.46%
jan 1, 2001
2.03
+0.255
14.37%
jan 1, 2002
1.438
-0.591
-29.13%
jan 1, 2003
1.297
-0.142
-9.84%
jan 1, 2004
1.316
+0.019
1.44%
jan 1, 2005
1.198
-0.117
-8.91%
jan 1, 2006
1.792
+0.594
49.54%
jan 1, 2007
2.172
+0.38
21.19%
jan 1, 2008
2.252
+0.081
3.71%
jan 1, 2009
2.587
+0.334
14.85%
jan 1, 2010
3.157
+0.57
22.03%
jan 1, 2011
3.544
+0.387
12.27%
jan 1, 2012
4.222
+0.678
19.14%
jan 1, 2013
3.551
-0.671
-15.89%
jan 1, 2014
2.954
-0.597
-16.81%
jan 1, 2015
4.089
+1.135
38.42%
Ranking of countries by current statistics by years


Comments: