29
/
en
AIzaSyAYiBZKx7MnpbEhh9jyipgxe19OcubqV5w
April 1, 2024
24284
Arab World
ARB
false
2
1
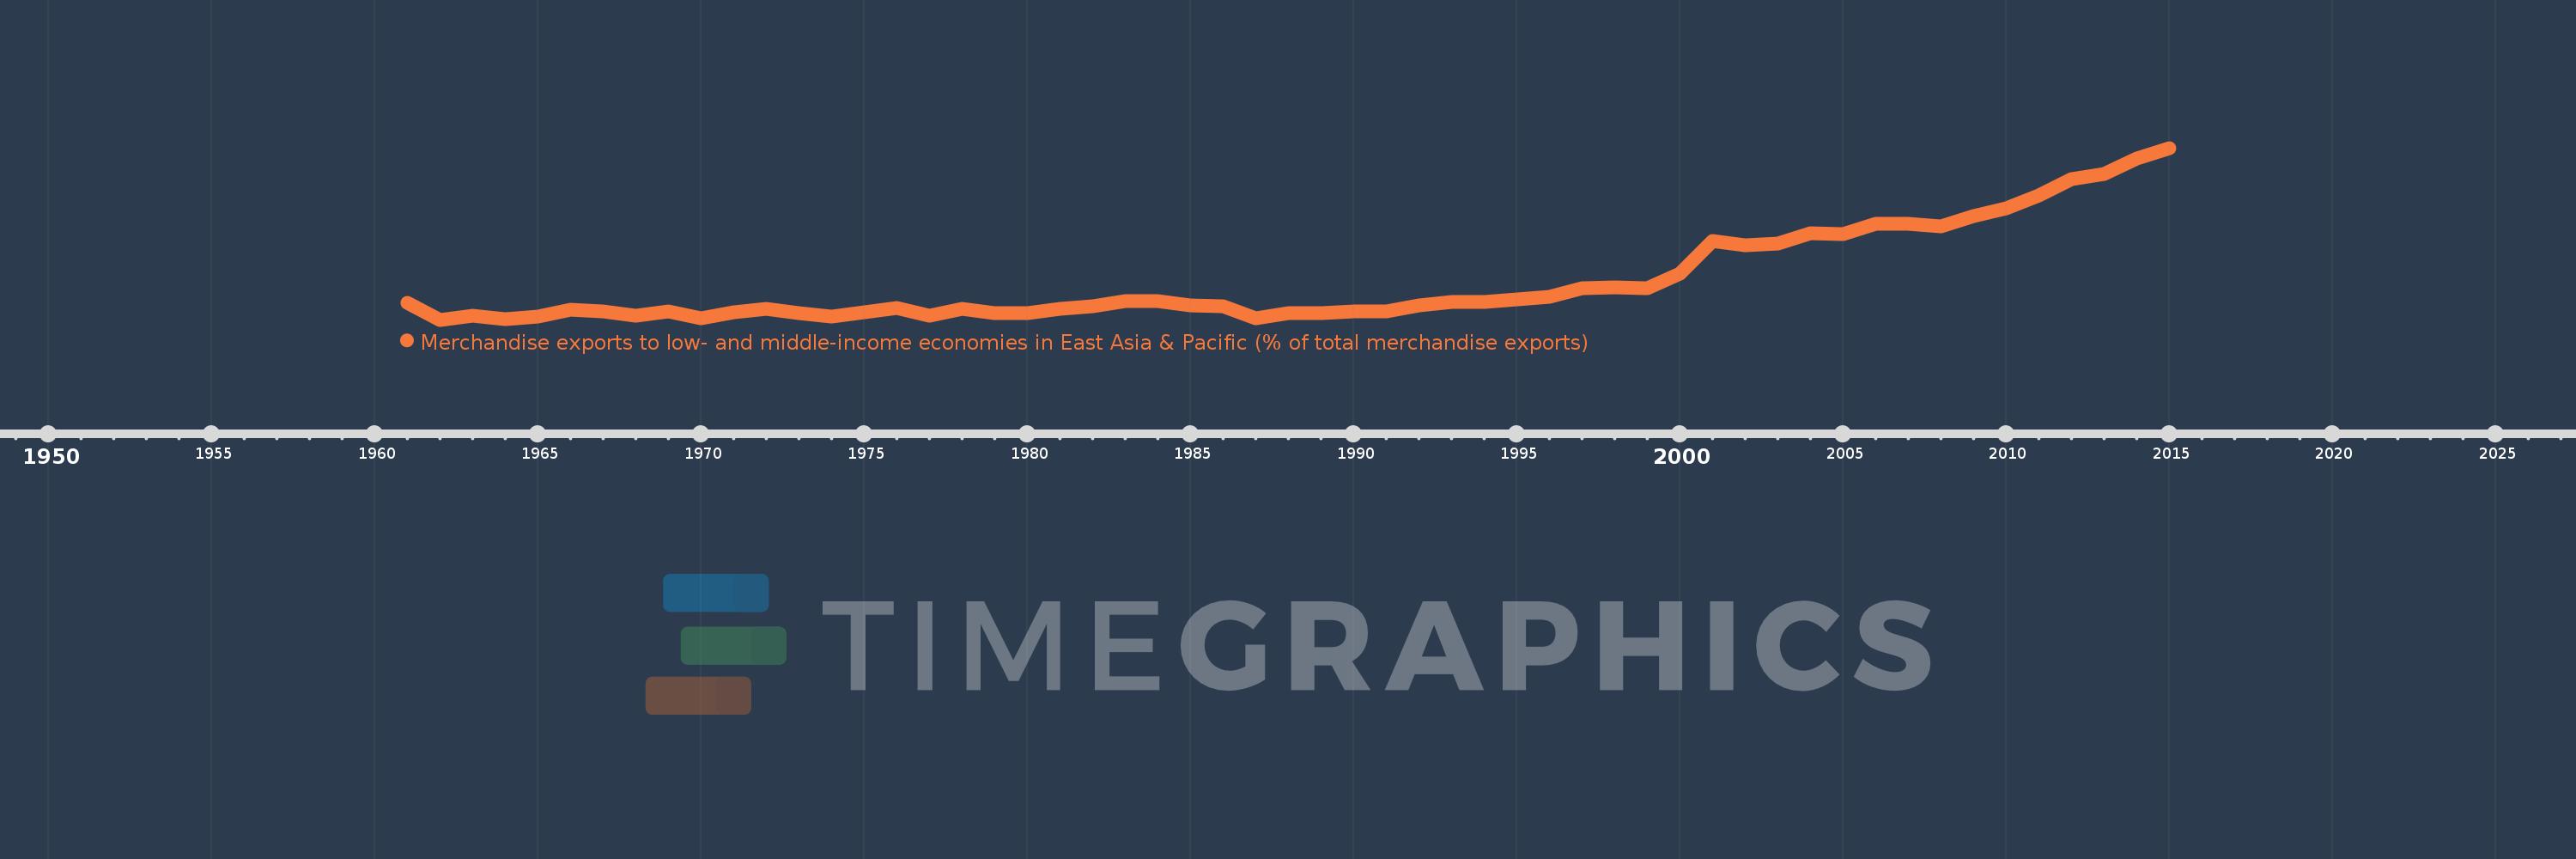
Merchandise exports to low- and middle-income economies in East Asia & Pacific (% of total merchandise exports)
2015,2014,2013,2012,2011,2010,2009,2008,2007,2006,2005,2004,2003,2002,2001,2000,1999,1998,1997,1996,1995,1994,1993,1992,1991,1990,1989,1988,1987,1986,1985,1984,1983,1982,1981,1980,1979,1978,1977,1976,1975,1974,1973,1972,1971,1970,1969,1968,1967,1966,1965,1964,1963,1962,1961
This statistics in other country:
AfghanistanAlbaniaAlgeriaArab WorldArgentinaAustraliaAustriaAzerbaijanBahamas, TheBahrainBangladeshBarbadosBelarusBelgiumBermudaBrazilBrunei DarussalamBulgariaCabo VerdeCambodiaCameroonCanadaCaribbean small statesCentral Europe and the BalticsChileChinaColombiaCosta RicaCote d'IvoireCroatiaCubaCyprusCzech RepublicDenmarkDominicaDominican RepublicEarly-demographic dividendEast Asia & PacificEast Asia & Pacific (excluding high income)East Asia & Pacific (IDA & IBRD countries)EcuadorEgypt, Arab Rep.El SalvadorEstoniaEthiopiaEuro areaEurope & Central AsiaEurope & Central Asia (excluding high income)Europe & Central Asia (IDA & IBRD countries)European UnionFijiFinlandFragile and conflict affected situationsFranceGermanyGhanaGreeceGuatemalaGuyanaHeavily indebted poor countries (HIPC)High incomeHondurasHong Kong SAR, ChinaHungaryIBRD onlyIcelandIDA & IBRD totalIDA blendIDA onlyIDA totalIndiaIndonesiaIran, Islamic Rep.IraqIrelandIsraelItalyJamaicaJapanJordanKazakhstanKenyaKorea, Dem. People’s Rep.Korea, Rep.KuwaitLate-demographic dividendLatin America & Caribbean Latin America & Caribbean (excluding high income)Latin America & the Caribbean (IDA & IBRD countries)LatviaLeast developed countries: UN classificationLebanonLithuaniaLow & middle incomeLow incomeLower middle incomeLuxembourgMacao SAR, ChinaMacedonia, FYRMadagascarMalaysiaMaltaMauritiusMexicoMiddle East & North AfricaMiddle East & North Africa (excluding high income)Middle East & North Africa (IDA & IBRD countries)Middle incomeMoldovaMontenegroMoroccoMozambiqueMyanmarNetherlandsNew CaledoniaNew ZealandNigeriaNorth AmericaNorwayOECD membersOmanOther small statesPacific island small statesPakistanPapua New GuineaParaguayPeruPhilippinesPolandPortugalPost-demographic dividendPre-demographic dividendQatarRomaniaRussian FederationSaudi ArabiaSenegalSerbiaSingaporeSlovak RepublicSloveniaSmall statesSolomon IslandsSomaliaSouth AfricaSouth AsiaSouth Asia (IDA & IBRD)SpainSri LankaSt. LuciaSub-Saharan Africa Sub-Saharan Africa (excluding high income)Sub-Saharan Africa (IDA & IBRD countries)SurinameSwedenSwitzerlandSyrian Arab RepublicTanzaniaThailandTogoTongaTrinidad and TobagoTunisiaTurkeyUgandaUkraineUnited Arab EmiratesUnited KingdomUnited StatesUpper middle incomeVenezuela, RBVietnamWorldYemen, Rep.ZambiaZimbabwe Timeline:
This timeline shows a graph from 1961 to 2015 of Arab World. No data until 1960. Number of actual observations by date: 55.
Source name:
World Development Indicators
Source organization:
World Bank staff estimates based data from International Monetary Fund's Direction of Trade database.
Categories, topics:
Private Sector, Trade
Last updated:
apr 23, 2017
Indicators value changes by year
At the date of observation
Value
Absolute change
Change from previous value
jan 1, 1961
2.26
+2.26
0.0%
jan 1, 1962
0.825
-1.435
-63.49%
jan 1, 1963
1.153
+0.328
39.69%
jan 1, 1964
0.87
-0.283
-24.53%
jan 1, 1965
1.072
+0.202
23.27%
jan 1, 1966
1.731
+0.659
61.44%
jan 1, 1967
1.557
-0.175
-10.09%
jan 1, 1968
1.147
-0.41
-26.33%
jan 1, 1969
1.558
+0.411
35.87%
jan 1, 1970
0.971
-0.587
-37.67%
jan 1, 1971
1.442
+0.471
48.47%
jan 1, 1972
1.753
+0.311
21.56%
jan 1, 1973
1.427
-0.326
-18.61%
jan 1, 1974
1.133
-0.294
-20.58%
jan 1, 1975
1.461
+0.328
28.97%
jan 1, 1976
1.818
+0.356
24.36%
jan 1, 1977
1.181
-0.636
-35.01%
jan 1, 1978
1.745
+0.563
47.7%
jan 1, 1979
1.389
-0.356
-20.38%
jan 1, 1980
1.422
+0.033
2.35%
jan 1, 1981
1.789
+0.367
25.82%
jan 1, 1982
1.984
+0.195
10.92%
jan 1, 1983
2.469
+0.485
24.42%
jan 1, 1984
2.412
-0.057
-2.32%
jan 1, 1985
2.049
-0.363
-15.05%
jan 1, 1986
2.005
-0.044
-2.15%
jan 1, 1987
0.925
-1.08
-53.85%
jan 1, 1988
1.369
+0.444
47.94%
jan 1, 1989
1.378
+0.01
0.71%
jan 1, 1990
1.573
+0.194
14.11%
jan 1, 1991
1.516
-0.057
-3.62%
jan 1, 1992
2.035
+0.519
34.21%
jan 1, 1993
2.333
+0.299
14.68%
jan 1, 1994
2.369
+0.035
1.52%
jan 1, 1995
2.598
+0.229
9.67%
jan 1, 1996
2.785
+0.187
7.21%
jan 1, 1997
3.567
+0.782
28.07%
jan 1, 1998
3.597
+0.03
0.83%
jan 1, 1999
3.574
-0.023
-0.64%
jan 1, 2000
4.805
+1.231
34.44%
jan 1, 2001
7.662
+2.858
59.48%
jan 1, 2002
7.274
-0.388
-5.07%
jan 1, 2003
7.447
+0.173
2.38%
jan 1, 2004
8.278
+0.831
11.16%
jan 1, 2005
8.23
-0.048
-0.58%
jan 1, 2006
9.139
+0.908
11.03%
jan 1, 2007
9.109
-0.029
-0.32%
jan 1, 2008
8.902
-0.207
-2.27%
jan 1, 2009
9.825
+0.923
10.37%
jan 1, 2010
10.472
+0.646
6.58%
jan 1, 2011
11.595
+1.123
10.73%
jan 1, 2012
13.005
+1.41
12.16%
jan 1, 2013
13.471
+0.465
3.58%
jan 1, 2014
14.765
+1.294
9.61%
jan 1, 2015
15.69
+0.925
6.26%
Ranking of countries by current statistics by years


Comments: