29
/
en
AIzaSyAYiBZKx7MnpbEhh9jyipgxe19OcubqV5w
April 1, 2024
40091
IDA total
IDA
false
2
1
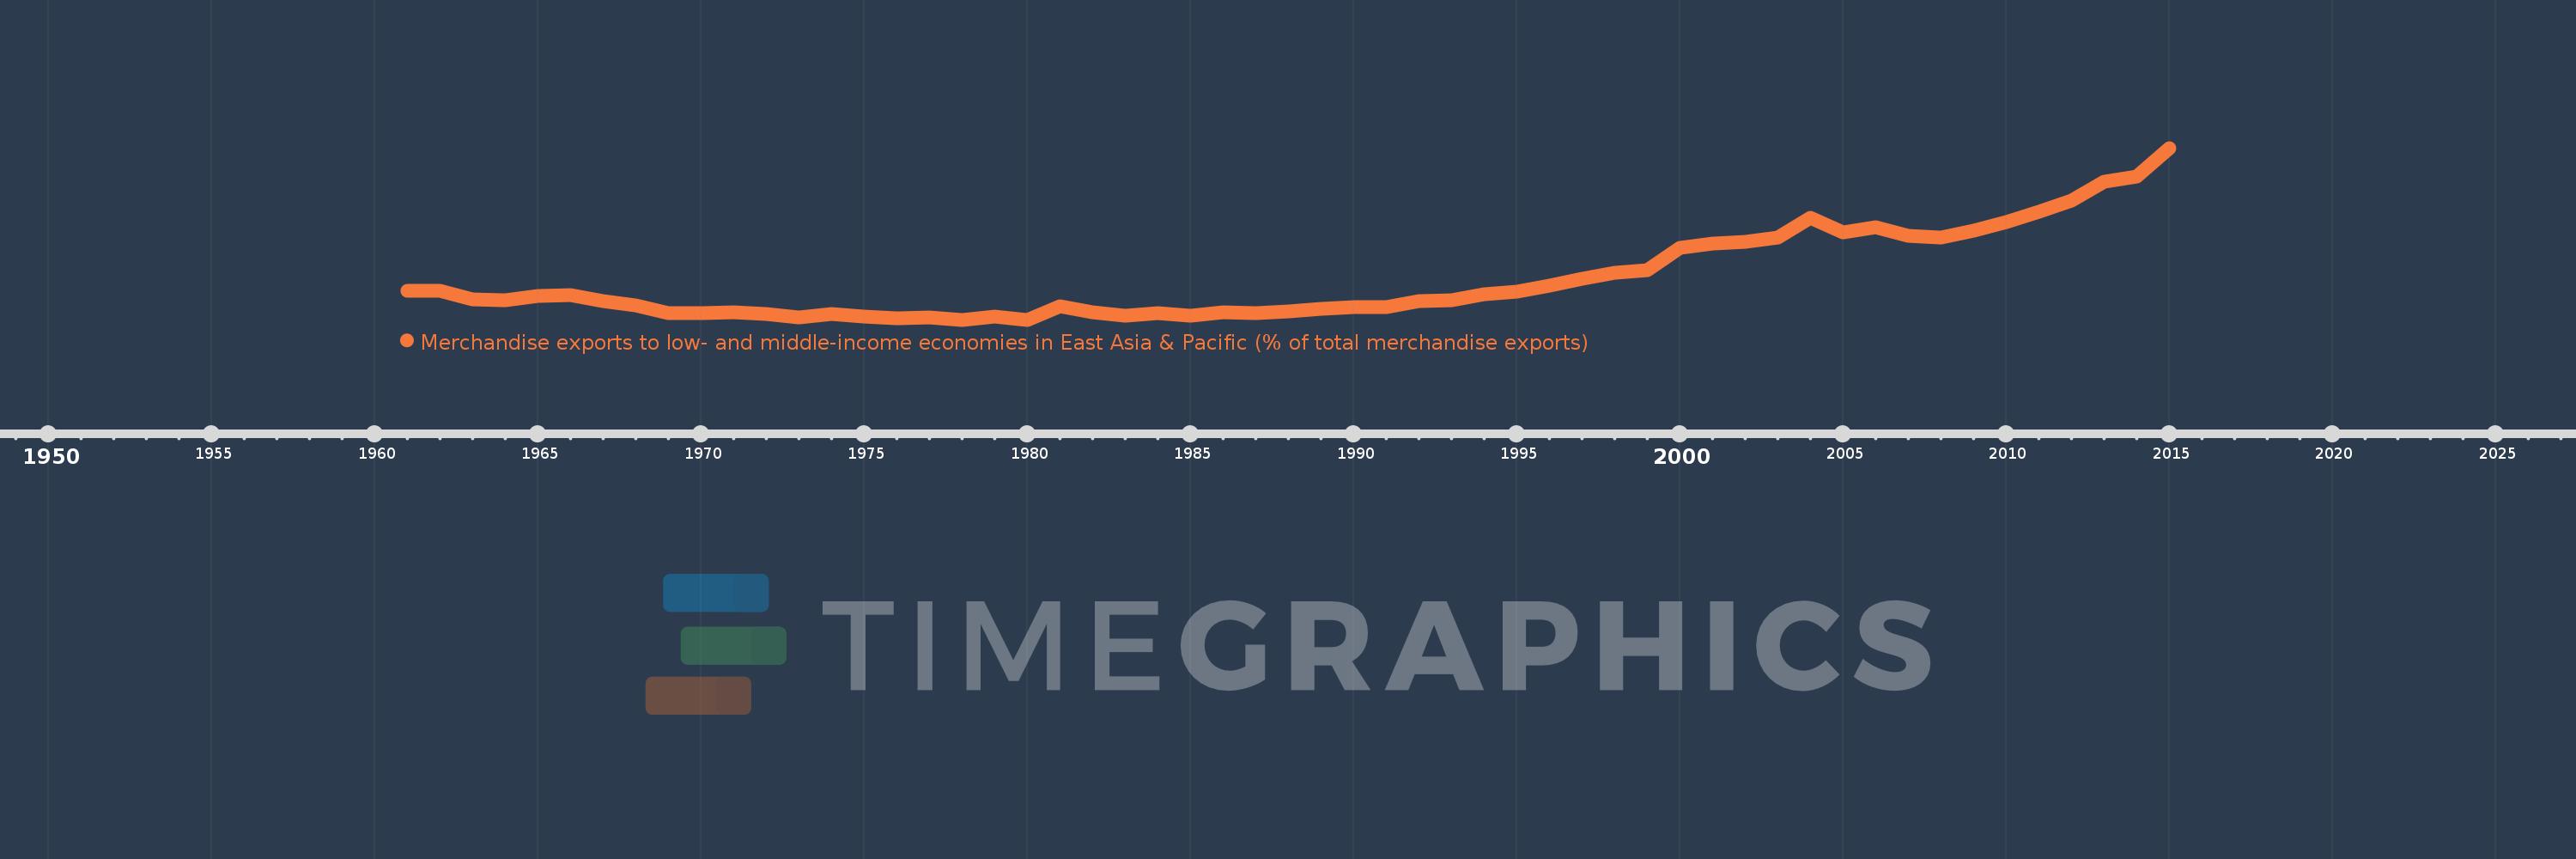
Merchandise exports to low- and middle-income economies in East Asia & Pacific (% of total merchandise exports)
2015,2014,2013,2012,2011,2010,2009,2008,2007,2006,2005,2004,2003,2002,2001,2000,1999,1998,1997,1996,1995,1994,1993,1992,1991,1990,1989,1988,1987,1986,1985,1984,1983,1982,1981,1980,1979,1978,1977,1976,1975,1974,1973,1972,1971,1970,1969,1968,1967,1966,1965,1964,1963,1962,1961
This statistics in other country:
AfghanistanAlbaniaAlgeriaArab WorldArgentinaAustraliaAustriaAzerbaijanBahamas, TheBahrainBangladeshBarbadosBelarusBelgiumBermudaBrazilBrunei DarussalamBulgariaCabo VerdeCambodiaCameroonCanadaCaribbean small statesCentral Europe and the BalticsChileChinaColombiaCosta RicaCote d'IvoireCroatiaCubaCyprusCzech RepublicDenmarkDominicaDominican RepublicEarly-demographic dividendEast Asia & PacificEast Asia & Pacific (excluding high income)East Asia & Pacific (IDA & IBRD countries)EcuadorEgypt, Arab Rep.El SalvadorEstoniaEthiopiaEuro areaEurope & Central AsiaEurope & Central Asia (excluding high income)Europe & Central Asia (IDA & IBRD countries)European UnionFijiFinlandFragile and conflict affected situationsFranceGermanyGhanaGreeceGuatemalaGuyanaHeavily indebted poor countries (HIPC)High incomeHondurasHong Kong SAR, ChinaHungaryIBRD onlyIcelandIDA & IBRD totalIDA blendIDA onlyIDA totalIndiaIndonesiaIran, Islamic Rep.IraqIrelandIsraelItalyJamaicaJapanJordanKazakhstanKenyaKorea, Dem. People’s Rep.Korea, Rep.KuwaitLate-demographic dividendLatin America & Caribbean Latin America & Caribbean (excluding high income)Latin America & the Caribbean (IDA & IBRD countries)LatviaLeast developed countries: UN classificationLebanonLithuaniaLow & middle incomeLow incomeLower middle incomeLuxembourgMacao SAR, ChinaMacedonia, FYRMadagascarMalaysiaMaltaMauritiusMexicoMiddle East & North AfricaMiddle East & North Africa (excluding high income)Middle East & North Africa (IDA & IBRD countries)Middle incomeMoldovaMontenegroMoroccoMozambiqueMyanmarNetherlandsNew CaledoniaNew ZealandNigeriaNorth AmericaNorwayOECD membersOmanOther small statesPacific island small statesPakistanPapua New GuineaParaguayPeruPhilippinesPolandPortugalPost-demographic dividendPre-demographic dividendQatarRomaniaRussian FederationSaudi ArabiaSenegalSerbiaSingaporeSlovak RepublicSloveniaSmall statesSolomon IslandsSomaliaSouth AfricaSouth AsiaSouth Asia (IDA & IBRD)SpainSri LankaSt. LuciaSub-Saharan Africa Sub-Saharan Africa (excluding high income)Sub-Saharan Africa (IDA & IBRD countries)SurinameSwedenSwitzerlandSyrian Arab RepublicTanzaniaThailandTogoTongaTrinidad and TobagoTunisiaTurkeyUgandaUkraineUnited Arab EmiratesUnited KingdomUnited StatesUpper middle incomeVenezuela, RBVietnamWorldYemen, Rep.ZambiaZimbabwe Timeline:
This timeline shows a graph from 1961 to 2015 of IDA total. No data until 1960. Number of actual observations by date: 55.
Source name:
World Development Indicators
Source organization:
World Bank staff estimates based data from International Monetary Fund's Direction of Trade database.
Categories, topics:
Private Sector, Trade
Last updated:
apr 23, 2017
Indicators value changes by year
At the date of observation
Value
Absolute change
Change from previous value
jan 1, 1961
3.018
+3.018
0.0%
jan 1, 1962
2.969
-0.049
-1.63%
jan 1, 1963
2.301
-0.668
-22.49%
jan 1, 1964
2.208
-0.093
-4.03%
jan 1, 1965
2.55
+0.341
15.44%
jan 1, 1966
2.657
+0.107
4.2%
jan 1, 1967
2.143
-0.514
-19.34%
jan 1, 1968
1.797
-0.346
-16.14%
jan 1, 1969
1.181
-0.616
-34.3%
jan 1, 1970
1.143
-0.037
-3.15%
jan 1, 1971
1.222
+0.079
6.88%
jan 1, 1972
1.077
-0.145
-11.9%
jan 1, 1973
0.831
-0.245
-22.77%
jan 1, 1974
1.107
+0.276
33.19%
jan 1, 1975
0.879
-0.228
-20.62%
jan 1, 1976
0.706
-0.173
-19.66%
jan 1, 1977
0.778
+0.072
10.15%
jan 1, 1978
0.61
-0.168
-21.65%
jan 1, 1979
0.86
+0.25
41.02%
jan 1, 1980
0.619
-0.241
-28.02%
jan 1, 1981
1.715
+1.097
177.25%
jan 1, 1982
1.251
-0.465
-27.09%
jan 1, 1983
0.959
-0.291
-23.3%
jan 1, 1984
1.128
+0.168
17.56%
jan 1, 1985
0.963
-0.164
-14.57%
jan 1, 1986
1.224
+0.261
27.04%
jan 1, 1987
1.165
-0.059
-4.79%
jan 1, 1988
1.265
+0.1
8.61%
jan 1, 1989
1.501
+0.235
18.59%
jan 1, 1990
1.662
+0.161
10.76%
jan 1, 1991
1.646
-0.017
-0.99%
jan 1, 1992
2.105
+0.46
27.94%
jan 1, 1993
2.199
+0.093
4.43%
jan 1, 1994
2.737
+0.539
24.5%
jan 1, 1995
2.899
+0.162
5.9%
jan 1, 1996
3.376
+0.477
16.45%
jan 1, 1997
3.988
+0.612
18.12%
jan 1, 1998
4.441
+0.454
11.37%
jan 1, 1999
4.654
+0.213
4.8%
jan 1, 2000
6.488
+1.834
39.4%
jan 1, 2001
6.841
+0.353
5.44%
jan 1, 2002
6.988
+0.147
2.14%
jan 1, 2003
7.365
+0.377
5.4%
jan 1, 2004
8.986
+1.621
22.01%
jan 1, 2005
7.751
-1.235
-13.75%
jan 1, 2006
8.203
+0.452
5.83%
jan 1, 2007
7.519
-0.684
-8.33%
jan 1, 2008
7.34
-0.179
-2.38%
jan 1, 2009
7.901
+0.561
7.64%
jan 1, 2010
8.653
+0.752
9.51%
jan 1, 2011
9.452
+0.799
9.24%
jan 1, 2012
10.41
+0.957
10.13%
jan 1, 2013
11.914
+1.504
14.45%
jan 1, 2014
12.376
+0.462
3.88%
jan 1, 2015
14.7
+2.325
18.78%
Ranking of countries by current statistics by years


Comments: