29
/
en
AIzaSyAYiBZKx7MnpbEhh9jyipgxe19OcubqV5w
April 1, 2024
32814
Europe & Central Asia (IDA & IBRD countries)
TEC
false
2
1
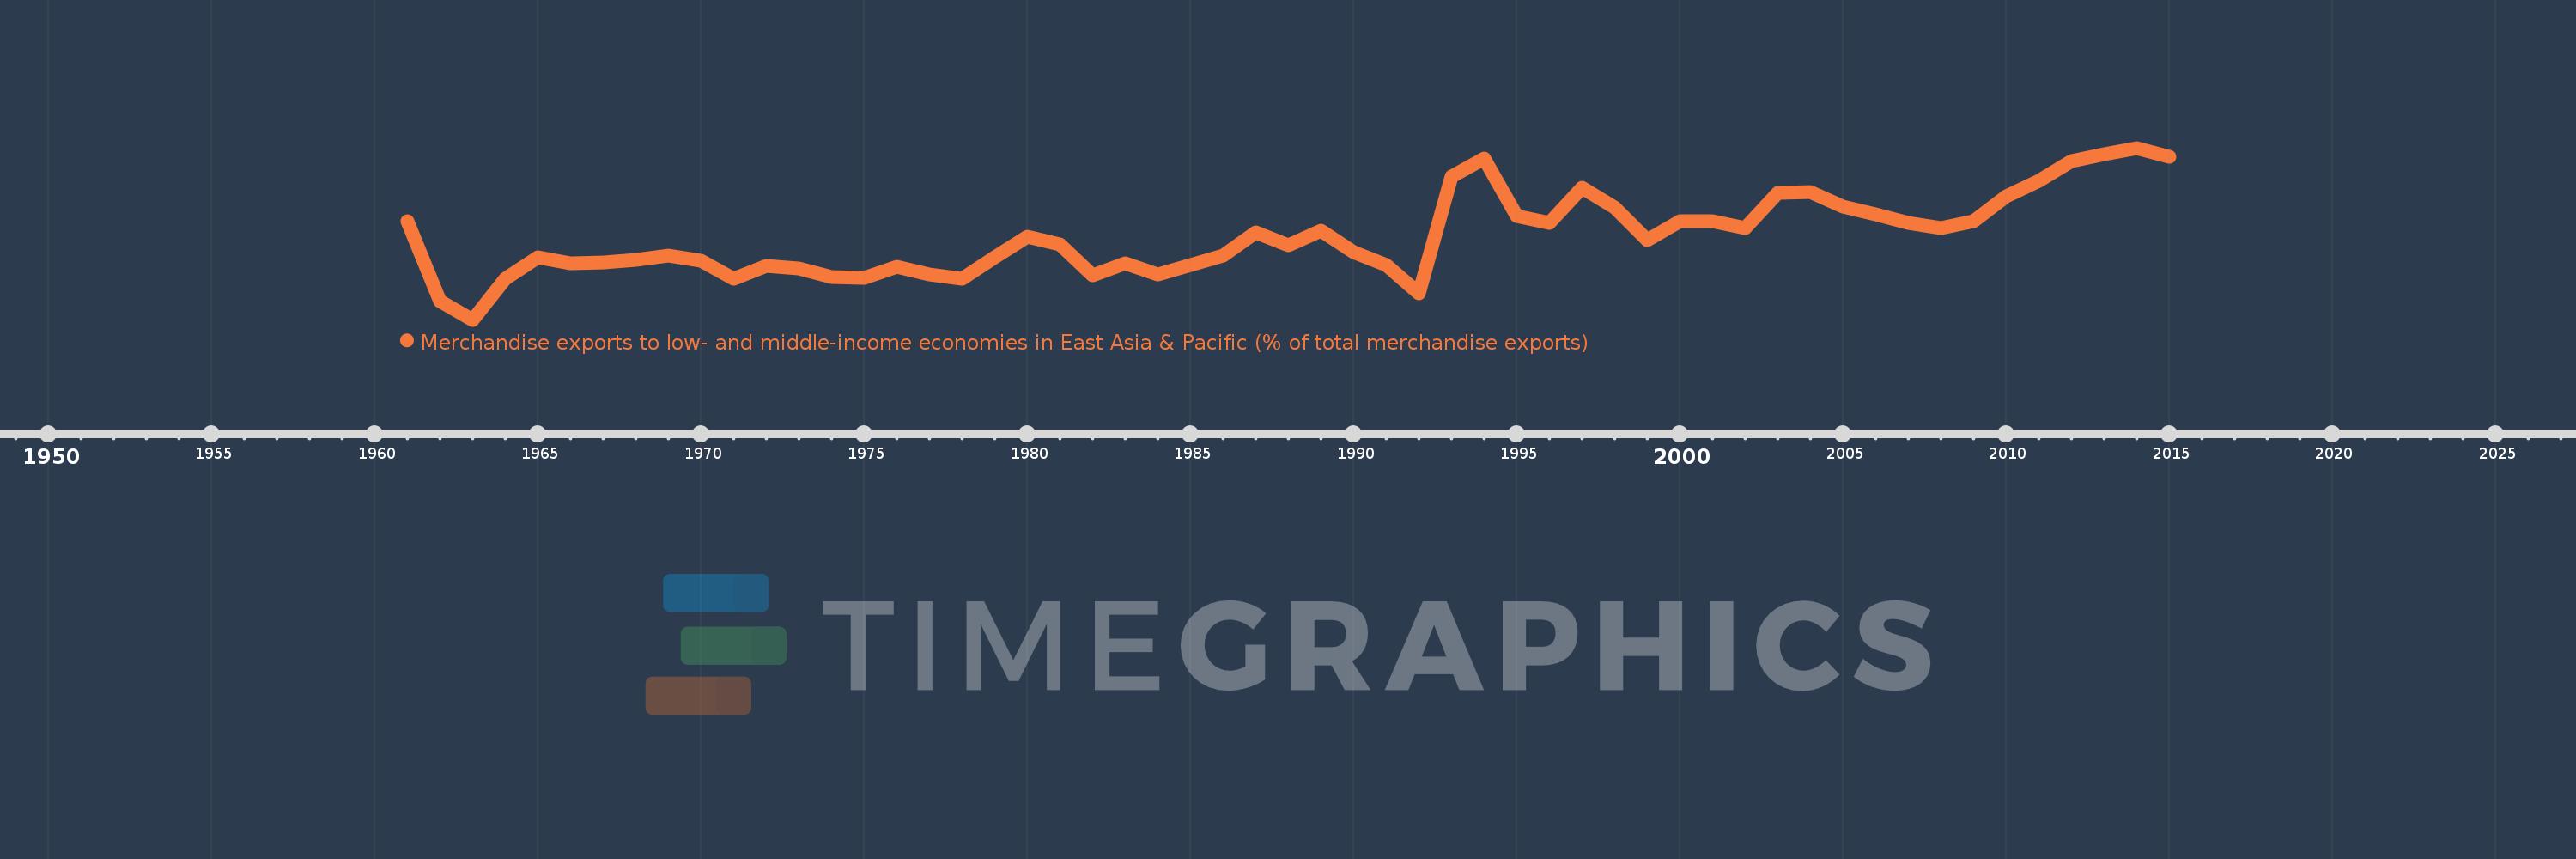
Merchandise exports to low- and middle-income economies in East Asia & Pacific (% of total merchandise exports)
2015,2014,2013,2012,2011,2010,2009,2008,2007,2006,2005,2004,2003,2002,2001,2000,1999,1998,1997,1996,1995,1994,1993,1992,1991,1990,1989,1988,1987,1986,1985,1984,1983,1982,1981,1980,1979,1978,1977,1976,1975,1974,1973,1972,1971,1970,1969,1968,1967,1966,1965,1964,1963,1962,1961
This statistics in other country:
AfghanistanAlbaniaAlgeriaArab WorldArgentinaAustraliaAustriaAzerbaijanBahamas, TheBahrainBangladeshBarbadosBelarusBelgiumBermudaBrazilBrunei DarussalamBulgariaCabo VerdeCambodiaCameroonCanadaCaribbean small statesCentral Europe and the BalticsChileChinaColombiaCosta RicaCote d'IvoireCroatiaCubaCyprusCzech RepublicDenmarkDominicaDominican RepublicEarly-demographic dividendEast Asia & PacificEast Asia & Pacific (excluding high income)East Asia & Pacific (IDA & IBRD countries)EcuadorEgypt, Arab Rep.El SalvadorEstoniaEthiopiaEuro areaEurope & Central AsiaEurope & Central Asia (excluding high income)Europe & Central Asia (IDA & IBRD countries)European UnionFijiFinlandFragile and conflict affected situationsFranceGermanyGhanaGreeceGuatemalaGuyanaHeavily indebted poor countries (HIPC)High incomeHondurasHong Kong SAR, ChinaHungaryIBRD onlyIcelandIDA & IBRD totalIDA blendIDA onlyIDA totalIndiaIndonesiaIran, Islamic Rep.IraqIrelandIsraelItalyJamaicaJapanJordanKazakhstanKenyaKorea, Dem. People’s Rep.Korea, Rep.KuwaitLate-demographic dividendLatin America & Caribbean Latin America & Caribbean (excluding high income)Latin America & the Caribbean (IDA & IBRD countries)LatviaLeast developed countries: UN classificationLebanonLithuaniaLow & middle incomeLow incomeLower middle incomeLuxembourgMacao SAR, ChinaMacedonia, FYRMadagascarMalaysiaMaltaMauritiusMexicoMiddle East & North AfricaMiddle East & North Africa (excluding high income)Middle East & North Africa (IDA & IBRD countries)Middle incomeMoldovaMontenegroMoroccoMozambiqueMyanmarNetherlandsNew CaledoniaNew ZealandNigeriaNorth AmericaNorwayOECD membersOmanOther small statesPacific island small statesPakistanPapua New GuineaParaguayPeruPhilippinesPolandPortugalPost-demographic dividendPre-demographic dividendQatarRomaniaRussian FederationSaudi ArabiaSenegalSerbiaSingaporeSlovak RepublicSloveniaSmall statesSolomon IslandsSomaliaSouth AfricaSouth AsiaSouth Asia (IDA & IBRD)SpainSri LankaSt. LuciaSub-Saharan Africa Sub-Saharan Africa (excluding high income)Sub-Saharan Africa (IDA & IBRD countries)SurinameSwedenSwitzerlandSyrian Arab RepublicTanzaniaThailandTogoTongaTrinidad and TobagoTunisiaTurkeyUgandaUkraineUnited Arab EmiratesUnited KingdomUnited StatesUpper middle incomeVenezuela, RBVietnamWorldYemen, Rep.ZambiaZimbabwe Timeline:
This timeline shows a graph from 1961 to 2015 of Europe & Central Asia (IDA & IBRD countries). No data until 1960. Number of actual observations by date: 55.
Source name:
World Development Indicators
Source organization:
World Bank staff estimates based data from International Monetary Fund's Direction of Trade database.
Categories, topics:
Private Sector, Trade
Last updated:
apr 23, 2017
Indicators value changes by year
At the date of observation
Value
Absolute change
Change from previous value
jan 1, 1961
3.798
+3.798
0.0%
jan 1, 1962
1.102
-2.696
-70.98%
jan 1, 1963
0.474
-0.628
-56.97%
jan 1, 1964
1.847
+1.373
289.53%
jan 1, 1965
2.592
+0.745
40.31%
jan 1, 1966
2.375
-0.217
-8.36%
jan 1, 1967
2.403
+0.028
1.18%
jan 1, 1968
2.502
+0.098
4.1%
jan 1, 1969
2.646
+0.144
5.75%
jan 1, 1970
2.464
-0.182
-6.87%
jan 1, 1971
1.851
-0.613
-24.87%
jan 1, 1972
2.291
+0.439
23.74%
jan 1, 1973
2.217
-0.074
-3.23%
jan 1, 1974
1.905
-0.312
-14.06%
jan 1, 1975
1.904
0.0
-0.02%
jan 1, 1976
2.271
+0.366
19.22%
jan 1, 1977
2.012
-0.259
-11.4%
jan 1, 1978
1.867
-0.144
-7.17%
jan 1, 1979
2.585
+0.717
38.4%
jan 1, 1980
3.292
+0.708
27.38%
jan 1, 1981
3.015
-0.277
-8.41%
jan 1, 1982
1.985
-1.03
-34.17%
jan 1, 1983
2.375
+0.39
19.64%
jan 1, 1984
1.993
-0.382
-16.07%
jan 1, 1985
2.328
+0.335
16.79%
jan 1, 1986
2.648
+0.32
13.76%
jan 1, 1987
3.439
+0.791
29.87%
jan 1, 1988
2.991
-0.449
-13.04%
jan 1, 1989
3.501
+0.51
17.07%
jan 1, 1990
2.774
-0.727
-20.78%
jan 1, 1991
2.319
-0.455
-16.41%
jan 1, 1992
1.374
-0.945
-40.76%
jan 1, 1993
5.31
+3.937
286.6%
jan 1, 1994
5.925
+0.614
11.57%
jan 1, 1995
3.991
-1.933
-32.63%
jan 1, 1996
3.743
-0.248
-6.21%
jan 1, 1997
4.954
+1.211
32.35%
jan 1, 1998
4.273
-0.681
-13.74%
jan 1, 1999
3.174
-1.099
-25.71%
jan 1, 2000
3.801
+0.626
19.73%
jan 1, 2001
3.822
+0.022
0.57%
jan 1, 2002
3.564
-0.258
-6.75%
jan 1, 2003
4.764
+1.2
33.67%
jan 1, 2004
4.811
+0.047
0.98%
jan 1, 2005
4.3
-0.511
-10.62%
jan 1, 2006
4.051
-0.249
-5.78%
jan 1, 2007
3.759
-0.292
-7.21%
jan 1, 2008
3.565
-0.194
-5.16%
jan 1, 2009
3.817
+0.252
7.07%
jan 1, 2010
4.644
+0.827
21.66%
jan 1, 2011
5.172
+0.528
11.37%
jan 1, 2012
5.845
+0.673
13.01%
jan 1, 2013
6.078
+0.233
3.99%
jan 1, 2014
6.288
+0.21
3.46%
jan 1, 2015
5.986
-0.302
-4.8%
Ranking of countries by current statistics by years


Comments: