29
/
en
AIzaSyAYiBZKx7MnpbEhh9jyipgxe19OcubqV5w
April 1, 2024
164006
Japan
JPN
true
2
1
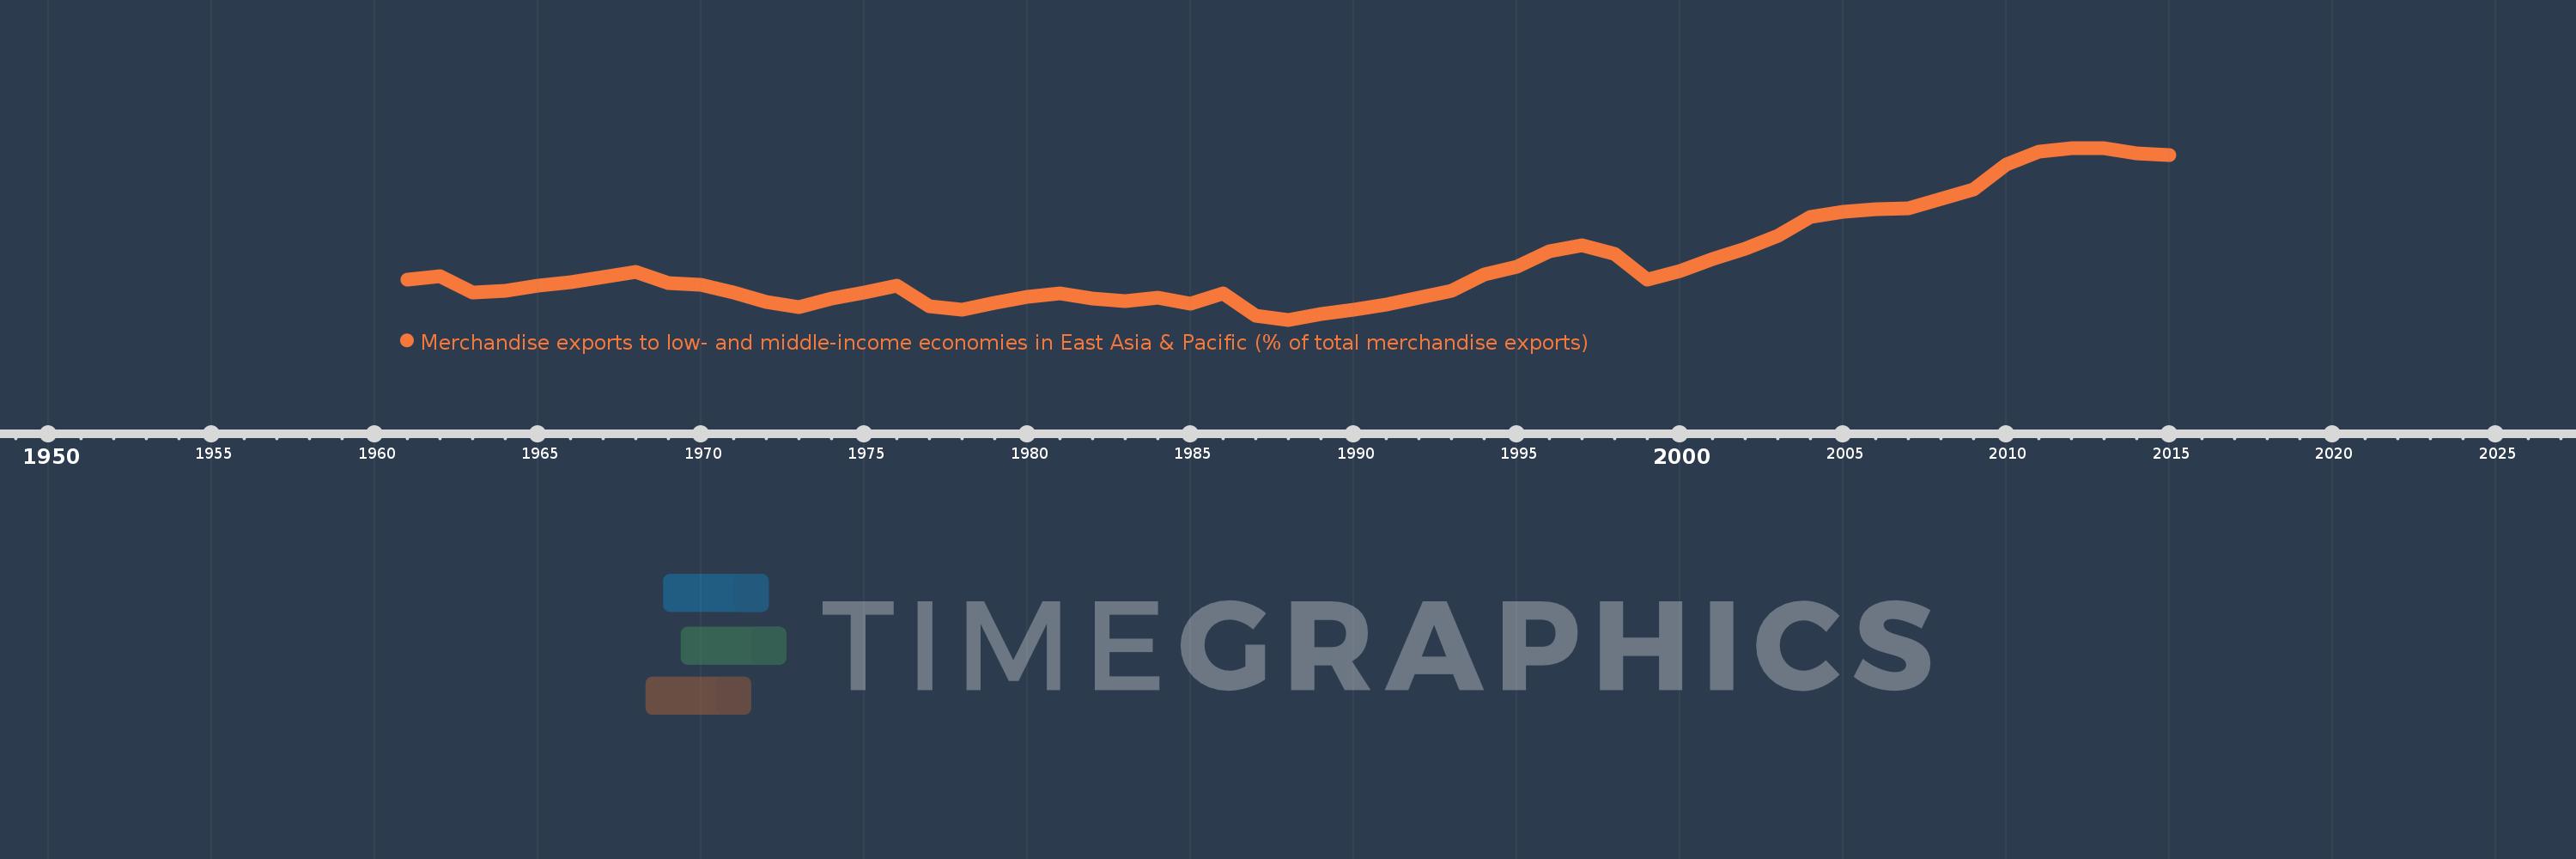
Merchandise exports to low- and middle-income economies in East Asia & Pacific (% of total merchandise exports)
2015,2014,2013,2012,2011,2010,2009,2008,2007,2006,2005,2004,2003,2002,2001,2000,1999,1998,1997,1996,1995,1994,1993,1992,1991,1990,1989,1988,1987,1986,1985,1984,1983,1982,1981,1980,1979,1978,1977,1976,1975,1974,1973,1972,1971,1970,1969,1968,1967,1966,1965,1964,1963,1962,1961
This statistics in other country:
AfghanistanAlbaniaAlgeriaArab WorldArgentinaAustraliaAustriaAzerbaijanBahamas, TheBahrainBangladeshBarbadosBelarusBelgiumBermudaBrazilBrunei DarussalamBulgariaCabo VerdeCambodiaCameroonCanadaCaribbean small statesCentral Europe and the BalticsChileChinaColombiaCosta RicaCote d'IvoireCroatiaCubaCyprusCzech RepublicDenmarkDominicaDominican RepublicEarly-demographic dividendEast Asia & PacificEast Asia & Pacific (excluding high income)East Asia & Pacific (IDA & IBRD countries)EcuadorEgypt, Arab Rep.El SalvadorEstoniaEthiopiaEuro areaEurope & Central AsiaEurope & Central Asia (excluding high income)Europe & Central Asia (IDA & IBRD countries)European UnionFijiFinlandFragile and conflict affected situationsFranceGermanyGhanaGreeceGuatemalaGuyanaHeavily indebted poor countries (HIPC)High incomeHondurasHong Kong SAR, ChinaHungaryIBRD onlyIcelandIDA & IBRD totalIDA blendIDA onlyIDA totalIndiaIndonesiaIran, Islamic Rep.IraqIrelandIsraelItalyJamaicaJapanJordanKazakhstanKenyaKorea, Dem. People’s Rep.Korea, Rep.KuwaitLate-demographic dividendLatin America & Caribbean Latin America & Caribbean (excluding high income)Latin America & the Caribbean (IDA & IBRD countries)LatviaLeast developed countries: UN classificationLebanonLithuaniaLow & middle incomeLow incomeLower middle incomeLuxembourgMacao SAR, ChinaMacedonia, FYRMadagascarMalaysiaMaltaMauritiusMexicoMiddle East & North AfricaMiddle East & North Africa (excluding high income)Middle East & North Africa (IDA & IBRD countries)Middle incomeMoldovaMontenegroMoroccoMozambiqueMyanmarNetherlandsNew CaledoniaNew ZealandNigeriaNorth AmericaNorwayOECD membersOmanOther small statesPacific island small statesPakistanPapua New GuineaParaguayPeruPhilippinesPolandPortugalPost-demographic dividendPre-demographic dividendQatarRomaniaRussian FederationSaudi ArabiaSenegalSerbiaSingaporeSlovak RepublicSloveniaSmall statesSolomon IslandsSomaliaSouth AfricaSouth AsiaSouth Asia (IDA & IBRD)SpainSri LankaSt. LuciaSub-Saharan Africa Sub-Saharan Africa (excluding high income)Sub-Saharan Africa (IDA & IBRD countries)SurinameSwedenSwitzerlandSyrian Arab RepublicTanzaniaThailandTogoTongaTrinidad and TobagoTunisiaTurkeyUgandaUkraineUnited Arab EmiratesUnited KingdomUnited StatesUpper middle incomeVenezuela, RBVietnamWorldYemen, Rep.ZambiaZimbabwe Timeline:
This timeline shows a graph from 1961 to 2015 of Japan. No data until 1960. Number of actual observations by date: 55.
Source name:
World Development Indicators
Source organization:
World Bank staff estimates based data from International Monetary Fund's Direction of Trade database.
Categories, topics:
Private Sector, Trade
Last updated:
apr 23, 2017
Indicators value changes by year
Maximum:
31.446
jan 1, 2013
At the date of observation
Value
Absolute change
Change from previous value
jan 1, 1961
13.63
+13.63
0.0%
jan 1, 1962
14.085
+0.456
3.34%
jan 1, 1963
11.87
-2.215
-15.73%
jan 1, 1964
12.017
+0.147
1.24%
jan 1, 1965
12.71
+0.693
5.77%
jan 1, 1966
13.272
+0.562
4.42%
jan 1, 1967
13.984
+0.711
5.36%
jan 1, 1968
14.614
+0.631
4.51%
jan 1, 1969
13.062
-1.553
-10.62%
jan 1, 1970
12.911
-0.151
-1.16%
jan 1, 1971
11.795
-1.116
-8.64%
jan 1, 1972
10.495
-1.3
-11.02%
jan 1, 1973
9.855
-0.64
-6.1%
jan 1, 1974
11.065
+1.21
12.28%
jan 1, 1975
11.846
+0.781
7.06%
jan 1, 1976
12.734
+0.887
7.49%
jan 1, 1977
9.907
-2.827
-22.2%
jan 1, 1978
9.456
-0.451
-4.55%
jan 1, 1979
10.474
+1.017
10.76%
jan 1, 1980
11.216
+0.742
7.09%
jan 1, 1981
11.725
+0.51
4.54%
jan 1, 1982
11.038
-0.688
-5.86%
jan 1, 1983
10.701
-0.337
-3.05%
jan 1, 1984
11.143
+0.442
4.13%
jan 1, 1985
10.267
-0.876
-7.87%
jan 1, 1986
11.734
+1.468
14.3%
jan 1, 1987
8.699
-3.035
-25.87%
jan 1, 1988
8.135
-0.564
-6.48%
jan 1, 1989
8.86
+0.725
8.91%
jan 1, 1990
9.473
+0.613
6.92%
jan 1, 1991
10.189
+0.716
7.56%
jan 1, 1992
11.076
+0.887
8.71%
jan 1, 1993
12.052
+0.975
8.81%
jan 1, 1994
14.247
+2.195
18.21%
jan 1, 1995
15.353
+1.107
7.77%
jan 1, 1996
17.437
+2.084
13.57%
jan 1, 1997
18.227
+0.79
4.53%
jan 1, 1998
17.051
-1.175
-6.45%
jan 1, 1999
13.521
-3.531
-20.71%
jan 1, 2000
14.781
+1.26
9.32%
jan 1, 2001
16.382
+1.601
10.84%
jan 1, 2002
17.772
+1.39
8.48%
jan 1, 2003
19.563
+1.791
10.08%
jan 1, 2004
22.052
+2.489
12.73%
jan 1, 2005
22.831
+0.778
3.53%
jan 1, 2006
23.168
+0.337
1.48%
jan 1, 2007
23.199
+0.031
0.13%
jan 1, 2008
24.497
+1.298
5.6%
jan 1, 2009
25.873
+1.376
5.62%
jan 1, 2010
29.224
+3.351
12.95%
jan 1, 2011
30.894
+1.67
5.71%
jan 1, 2012
31.4
+0.506
1.64%
jan 1, 2013
31.446
+0.046
0.15%
jan 1, 2014
30.763
-0.683
-2.17%
jan 1, 2015
30.51
-0.253
-0.82%
Ranking of countries by current statistics by years


Comments: