29
/
en
AIzaSyAYiBZKx7MnpbEhh9jyipgxe19OcubqV5w
April 1, 2024
35147
Heavily indebted poor countries (HIPC)
HPC
false
2
1
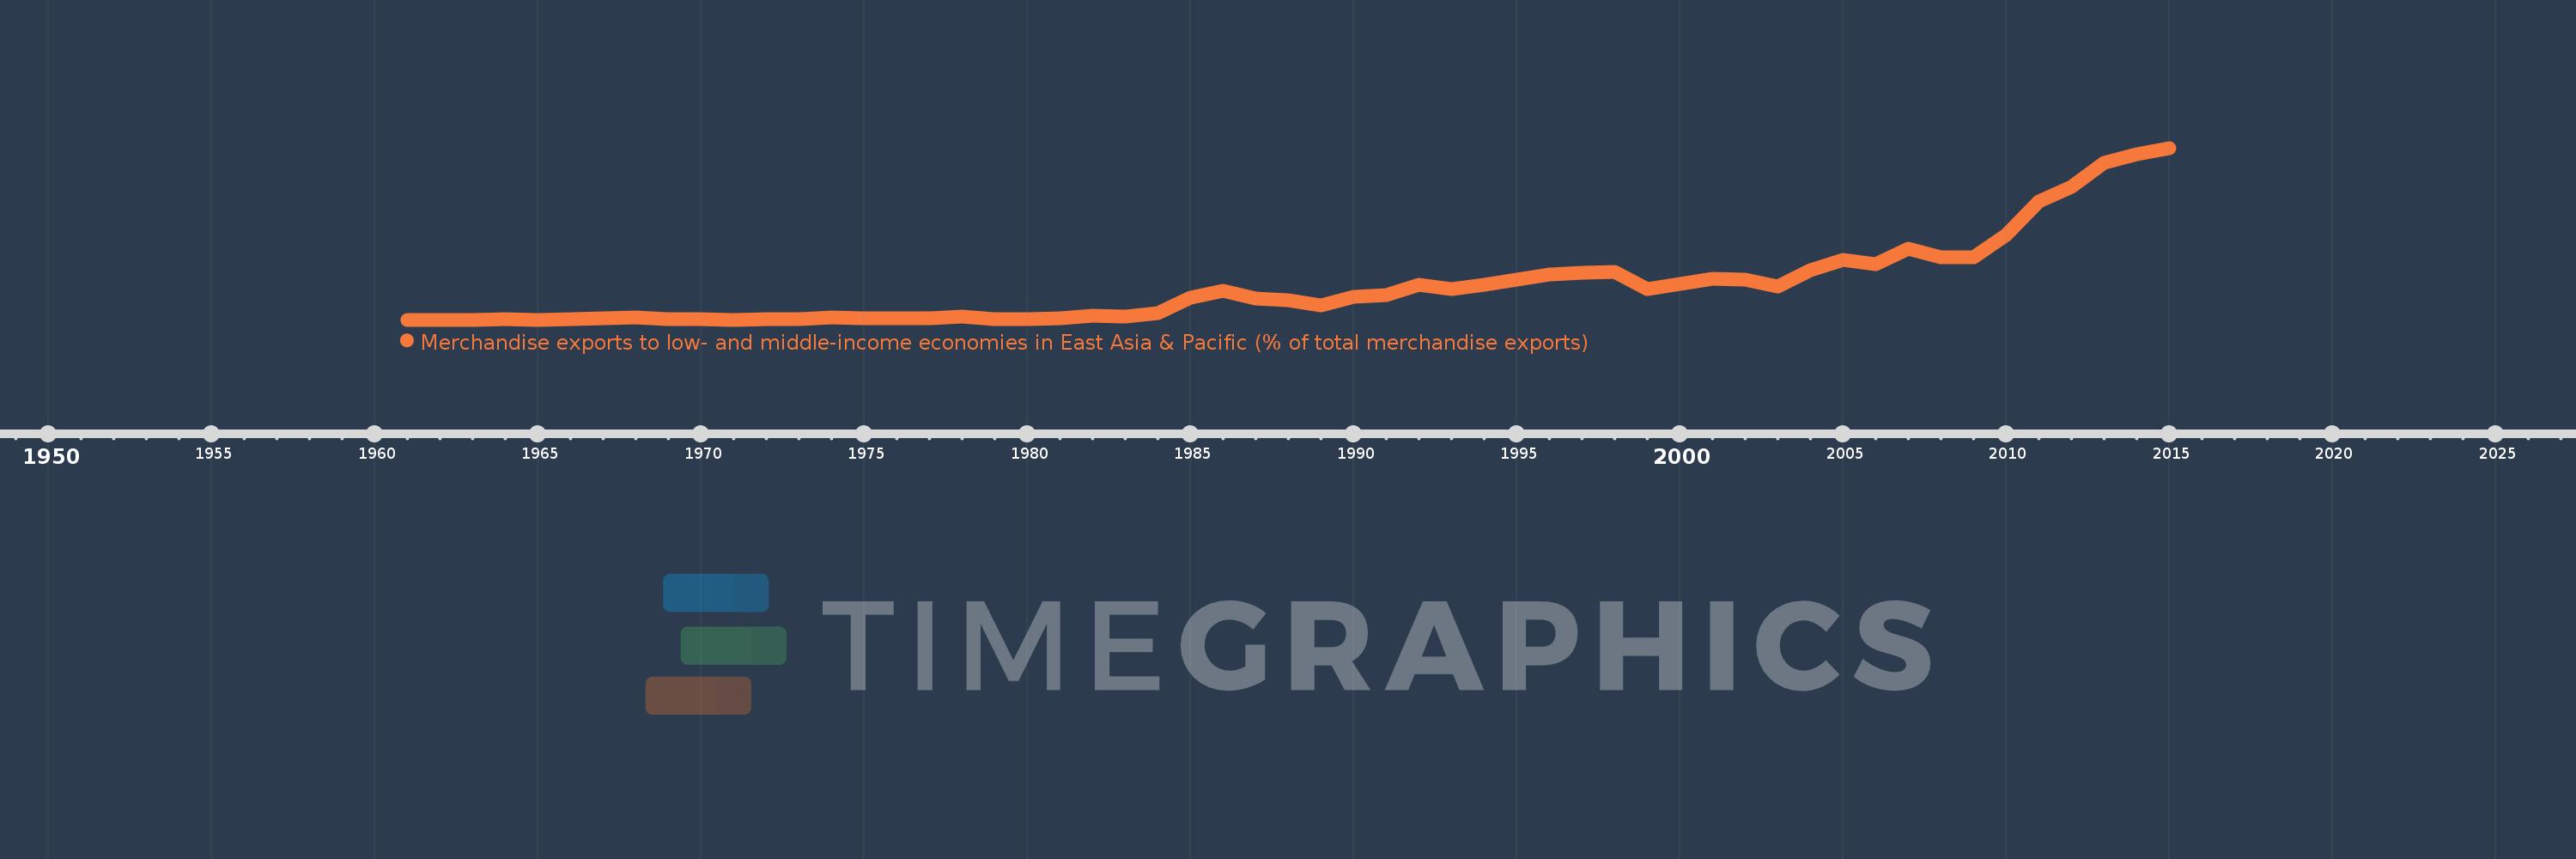
Merchandise exports to low- and middle-income economies in East Asia & Pacific (% of total merchandise exports)
2015,2014,2013,2012,2011,2010,2009,2008,2007,2006,2005,2004,2003,2002,2001,2000,1999,1998,1997,1996,1995,1994,1993,1992,1991,1990,1989,1988,1987,1986,1985,1984,1983,1982,1981,1980,1979,1978,1977,1976,1975,1974,1973,1972,1971,1970,1969,1968,1967,1966,1965,1964,1963,1962,1961
This statistics in other country:
AfghanistanAlbaniaAlgeriaArab WorldArgentinaAustraliaAustriaAzerbaijanBahamas, TheBahrainBangladeshBarbadosBelarusBelgiumBermudaBrazilBrunei DarussalamBulgariaCabo VerdeCambodiaCameroonCanadaCaribbean small statesCentral Europe and the BalticsChileChinaColombiaCosta RicaCote d'IvoireCroatiaCubaCyprusCzech RepublicDenmarkDominicaDominican RepublicEarly-demographic dividendEast Asia & PacificEast Asia & Pacific (excluding high income)East Asia & Pacific (IDA & IBRD countries)EcuadorEgypt, Arab Rep.El SalvadorEstoniaEthiopiaEuro areaEurope & Central AsiaEurope & Central Asia (excluding high income)Europe & Central Asia (IDA & IBRD countries)European UnionFijiFinlandFragile and conflict affected situationsFranceGermanyGhanaGreeceGuatemalaGuyanaHeavily indebted poor countries (HIPC)High incomeHondurasHong Kong SAR, ChinaHungaryIBRD onlyIcelandIDA & IBRD totalIDA blendIDA onlyIDA totalIndiaIndonesiaIran, Islamic Rep.IraqIrelandIsraelItalyJamaicaJapanJordanKazakhstanKenyaKorea, Dem. People’s Rep.Korea, Rep.KuwaitLate-demographic dividendLatin America & Caribbean Latin America & Caribbean (excluding high income)Latin America & the Caribbean (IDA & IBRD countries)LatviaLeast developed countries: UN classificationLebanonLithuaniaLow & middle incomeLow incomeLower middle incomeLuxembourgMacao SAR, ChinaMacedonia, FYRMadagascarMalaysiaMaltaMauritiusMexicoMiddle East & North AfricaMiddle East & North Africa (excluding high income)Middle East & North Africa (IDA & IBRD countries)Middle incomeMoldovaMontenegroMoroccoMozambiqueMyanmarNetherlandsNew CaledoniaNew ZealandNigeriaNorth AmericaNorwayOECD membersOmanOther small statesPacific island small statesPakistanPapua New GuineaParaguayPeruPhilippinesPolandPortugalPost-demographic dividendPre-demographic dividendQatarRomaniaRussian FederationSaudi ArabiaSenegalSerbiaSingaporeSlovak RepublicSloveniaSmall statesSolomon IslandsSomaliaSouth AfricaSouth AsiaSouth Asia (IDA & IBRD)SpainSri LankaSt. LuciaSub-Saharan Africa Sub-Saharan Africa (excluding high income)Sub-Saharan Africa (IDA & IBRD countries)SurinameSwedenSwitzerlandSyrian Arab RepublicTanzaniaThailandTogoTongaTrinidad and TobagoTunisiaTurkeyUgandaUkraineUnited Arab EmiratesUnited KingdomUnited StatesUpper middle incomeVenezuela, RBVietnamWorldYemen, Rep.ZambiaZimbabwe Timeline:
This timeline shows a graph from 1961 to 2015 of Heavily indebted poor countries (HIPC). No data until 1960. Number of actual observations by date: 55.
Source name:
World Development Indicators
Source organization:
World Bank staff estimates based data from International Monetary Fund's Direction of Trade database.
Categories, topics:
Private Sector, Trade
Last updated:
apr 23, 2017
Indicators value changes by year
At the date of observation
Value
Absolute change
Change from previous value
jan 1, 1964
0.011
+0.011
%
jan 1, 1965
0.0
-0.011
-100.0%
jan 1, 1966
0.009
+0.009
%
jan 1, 1967
0.054
+0.046
531.44%
jan 1, 1968
0.073
+0.018
33.16%
jan 1, 1969
0.019
-0.053
-73.13%
jan 1, 1970
0.024
+0.004
22.36%
jan 1, 1971
0.002
-0.022
-90.56%
jan 1, 1972
0.014
+0.012
536.99%
jan 1, 1973
0.024
+0.01
69.36%
jan 1, 1974
0.069
+0.045
185.89%
jan 1, 1975
0.056
-0.014
-19.99%
jan 1, 1976
0.063
+0.007
12.89%
jan 1, 1977
0.058
-0.005
-7.91%
jan 1, 1978
0.108
+0.05
87.35%
jan 1, 1979
0.022
-0.086
-79.32%
jan 1, 1980
0.019
-0.003
-13.21%
jan 1, 1981
0.065
+0.046
237.28%
jan 1, 1982
0.138
+0.073
110.87%
jan 1, 1983
0.121
-0.017
-12.52%
jan 1, 1984
0.233
+0.112
92.91%
jan 1, 1985
0.796
+0.563
241.7%
jan 1, 1986
1.042
+0.245
30.8%
jan 1, 1987
0.764
-0.278
-26.65%
jan 1, 1988
0.707
-0.057
-7.46%
jan 1, 1989
0.501
-0.206
-29.17%
jan 1, 1990
0.823
+0.323
64.41%
jan 1, 1991
0.868
+0.045
5.47%
jan 1, 1992
1.244
+0.376
43.26%
jan 1, 1993
1.089
-0.155
-12.47%
jan 1, 1994
1.231
+0.142
13.08%
jan 1, 1995
1.418
+0.187
15.18%
jan 1, 1996
1.602
+0.184
12.96%
jan 1, 1997
1.654
+0.052
3.28%
jan 1, 1998
1.698
+0.044
2.66%
jan 1, 1999
1.094
-0.604
-35.59%
jan 1, 2000
1.268
+0.174
15.88%
jan 1, 2001
1.452
+0.184
14.51%
jan 1, 2002
1.421
-0.031
-2.1%
jan 1, 2003
1.181
-0.24
-16.91%
jan 1, 2004
1.749
+0.568
48.11%
jan 1, 2005
2.111
+0.362
20.73%
jan 1, 2006
1.978
-0.133
-6.3%
jan 1, 2007
2.515
+0.537
27.13%
jan 1, 2008
2.222
-0.293
-11.67%
jan 1, 2009
2.207
-0.015
-0.67%
jan 1, 2010
2.999
+0.792
35.91%
jan 1, 2011
4.204
+1.205
40.16%
jan 1, 2012
4.719
+0.515
12.26%
jan 1, 2013
5.571
+0.852
18.06%
jan 1, 2014
5.862
+0.291
5.22%
jan 1, 2015
6.098
+0.236
4.03%
Ranking of countries by current statistics by years


Comments: