29
/
en
AIzaSyAYiBZKx7MnpbEhh9jyipgxe19OcubqV5w
April 1, 2024
40890
Late-demographic dividend
LTE
false
2
1
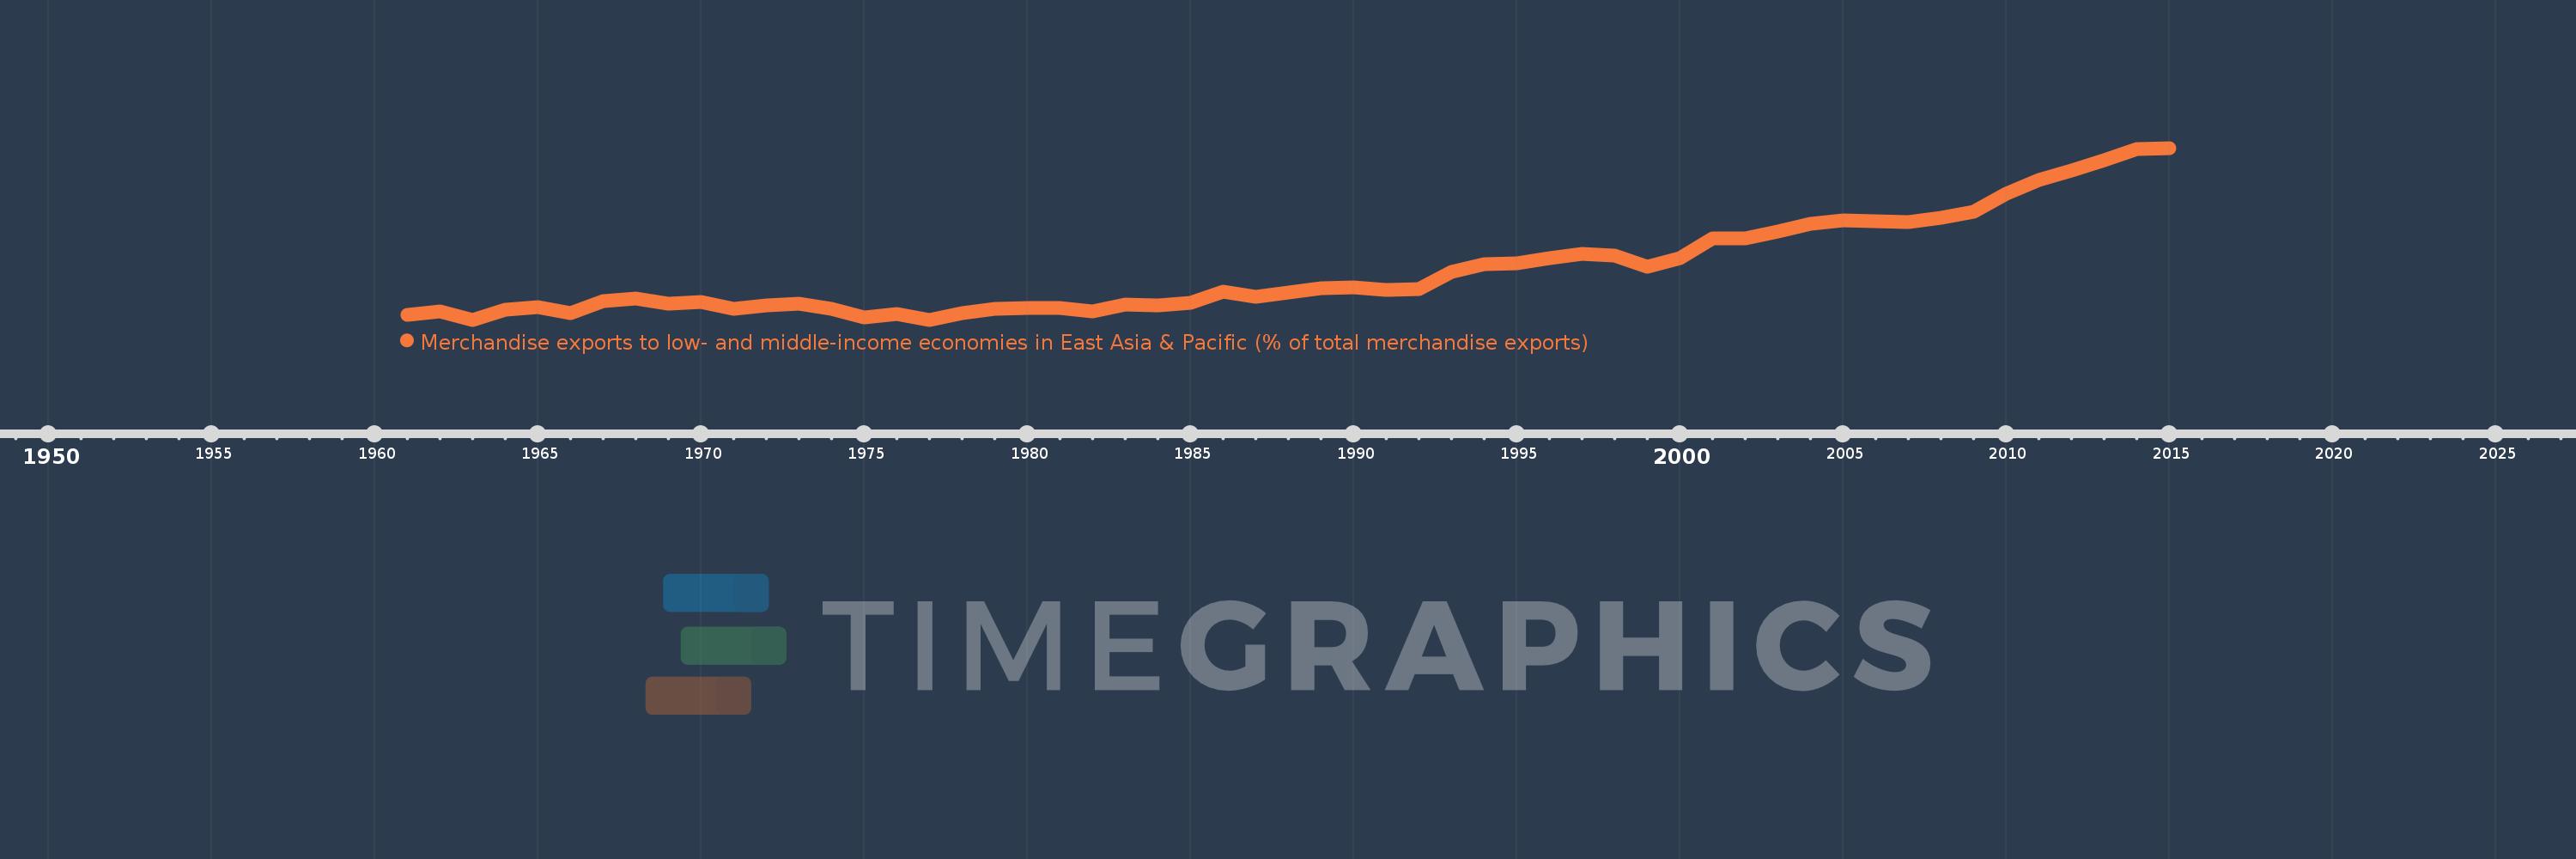
Merchandise exports to low- and middle-income economies in East Asia & Pacific (% of total merchandise exports)
2015,2014,2013,2012,2011,2010,2009,2008,2007,2006,2005,2004,2003,2002,2001,2000,1999,1998,1997,1996,1995,1994,1993,1992,1991,1990,1989,1988,1987,1986,1985,1984,1983,1982,1981,1980,1979,1978,1977,1976,1975,1974,1973,1972,1971,1970,1969,1968,1967,1966,1965,1964,1963,1962,1961
This statistics in other country:
AfghanistanAlbaniaAlgeriaArab WorldArgentinaAustraliaAustriaAzerbaijanBahamas, TheBahrainBangladeshBarbadosBelarusBelgiumBermudaBrazilBrunei DarussalamBulgariaCabo VerdeCambodiaCameroonCanadaCaribbean small statesCentral Europe and the BalticsChileChinaColombiaCosta RicaCote d'IvoireCroatiaCubaCyprusCzech RepublicDenmarkDominicaDominican RepublicEarly-demographic dividendEast Asia & PacificEast Asia & Pacific (excluding high income)East Asia & Pacific (IDA & IBRD countries)EcuadorEgypt, Arab Rep.El SalvadorEstoniaEthiopiaEuro areaEurope & Central AsiaEurope & Central Asia (excluding high income)Europe & Central Asia (IDA & IBRD countries)European UnionFijiFinlandFragile and conflict affected situationsFranceGermanyGhanaGreeceGuatemalaGuyanaHeavily indebted poor countries (HIPC)High incomeHondurasHong Kong SAR, ChinaHungaryIBRD onlyIcelandIDA & IBRD totalIDA blendIDA onlyIDA totalIndiaIndonesiaIran, Islamic Rep.IraqIrelandIsraelItalyJamaicaJapanJordanKazakhstanKenyaKorea, Dem. People’s Rep.Korea, Rep.KuwaitLate-demographic dividendLatin America & Caribbean Latin America & Caribbean (excluding high income)Latin America & the Caribbean (IDA & IBRD countries)LatviaLeast developed countries: UN classificationLebanonLithuaniaLow & middle incomeLow incomeLower middle incomeLuxembourgMacao SAR, ChinaMacedonia, FYRMadagascarMalaysiaMaltaMauritiusMexicoMiddle East & North AfricaMiddle East & North Africa (excluding high income)Middle East & North Africa (IDA & IBRD countries)Middle incomeMoldovaMontenegroMoroccoMozambiqueMyanmarNetherlandsNew CaledoniaNew ZealandNigeriaNorth AmericaNorwayOECD membersOmanOther small statesPacific island small statesPakistanPapua New GuineaParaguayPeruPhilippinesPolandPortugalPost-demographic dividendPre-demographic dividendQatarRomaniaRussian FederationSaudi ArabiaSenegalSerbiaSingaporeSlovak RepublicSloveniaSmall statesSolomon IslandsSomaliaSouth AfricaSouth AsiaSouth Asia (IDA & IBRD)SpainSri LankaSt. LuciaSub-Saharan Africa Sub-Saharan Africa (excluding high income)Sub-Saharan Africa (IDA & IBRD countries)SurinameSwedenSwitzerlandSyrian Arab RepublicTanzaniaThailandTogoTongaTrinidad and TobagoTunisiaTurkeyUgandaUkraineUnited Arab EmiratesUnited KingdomUnited StatesUpper middle incomeVenezuela, RBVietnamWorldYemen, Rep.ZambiaZimbabwe Timeline:
This timeline shows a graph from 1961 to 2015 of Late-demographic dividend. No data until 1960. Number of actual observations by date: 55.
Source name:
World Development Indicators
Source organization:
World Bank staff estimates based data from International Monetary Fund's Direction of Trade database.
Categories, topics:
Private Sector, Trade
Last updated:
apr 23, 2017
Indicators value changes by year
Maximum:
12.352
jan 1, 2015
At the date of observation
Value
Absolute change
Change from previous value
jan 1, 1961
1.805
+1.805
0.0%
jan 1, 1962
2.0
+0.195
10.77%
jan 1, 1963
1.492
-0.508
-25.39%
jan 1, 1964
2.141
+0.649
43.49%
jan 1, 1965
2.29
+0.149
6.97%
jan 1, 1966
1.9
-0.391
-17.06%
jan 1, 1967
2.649
+0.749
39.45%
jan 1, 1968
2.81
+0.161
6.06%
jan 1, 1969
2.532
-0.278
-9.88%
jan 1, 1970
2.598
+0.066
2.61%
jan 1, 1971
2.162
-0.436
-16.79%
jan 1, 1972
2.394
+0.233
10.76%
jan 1, 1973
2.516
+0.121
5.07%
jan 1, 1974
2.158
-0.358
-14.23%
jan 1, 1975
1.631
-0.527
-24.41%
jan 1, 1976
1.83
+0.199
12.18%
jan 1, 1977
1.495
-0.335
-18.32%
jan 1, 1978
1.9
+0.405
27.13%
jan 1, 1979
2.165
+0.265
13.92%
jan 1, 1980
2.261
+0.096
4.46%
jan 1, 1981
2.251
-0.01
-0.44%
jan 1, 1982
2.036
-0.215
-9.57%
jan 1, 1983
2.436
+0.4
19.65%
jan 1, 1984
2.423
-0.013
-0.52%
jan 1, 1985
2.575
+0.152
6.26%
jan 1, 1986
3.243
+0.668
25.95%
jan 1, 1987
2.945
-0.298
-9.18%
jan 1, 1988
3.227
+0.282
9.58%
jan 1, 1989
3.49
+0.263
8.14%
jan 1, 1990
3.515
+0.025
0.72%
jan 1, 1991
3.359
-0.156
-4.45%
jan 1, 1992
3.441
+0.082
2.45%
jan 1, 1993
4.512
+1.071
31.11%
jan 1, 1994
5.001
+0.489
10.85%
jan 1, 1995
5.041
+0.04
0.8%
jan 1, 1996
5.37
+0.329
6.52%
jan 1, 1997
5.647
+0.277
5.17%
jan 1, 1998
5.546
-0.101
-1.79%
jan 1, 1999
4.835
-0.711
-12.82%
jan 1, 2000
5.365
+0.53
10.95%
jan 1, 2001
6.624
+1.259
23.46%
jan 1, 2002
6.632
+0.009
0.13%
jan 1, 2003
7.085
+0.453
6.83%
jan 1, 2004
7.549
+0.464
6.55%
jan 1, 2005
7.753
+0.204
2.7%
jan 1, 2006
7.739
-0.013
-0.17%
jan 1, 2007
7.681
-0.058
-0.75%
jan 1, 2008
7.963
+0.282
3.67%
jan 1, 2009
8.292
+0.328
4.12%
jan 1, 2010
9.478
+1.186
14.31%
jan 1, 2011
10.322
+0.844
8.91%
jan 1, 2012
10.93
+0.608
5.89%
jan 1, 2013
11.586
+0.656
6.01%
jan 1, 2014
12.263
+0.677
5.84%
jan 1, 2015
12.352
+0.088
0.72%
Ranking of countries by current statistics by years


Comments: