29
/
en
AIzaSyAYiBZKx7MnpbEhh9jyipgxe19OcubqV5w
April 1, 2024
133392
Finland
FIN
true
2
1
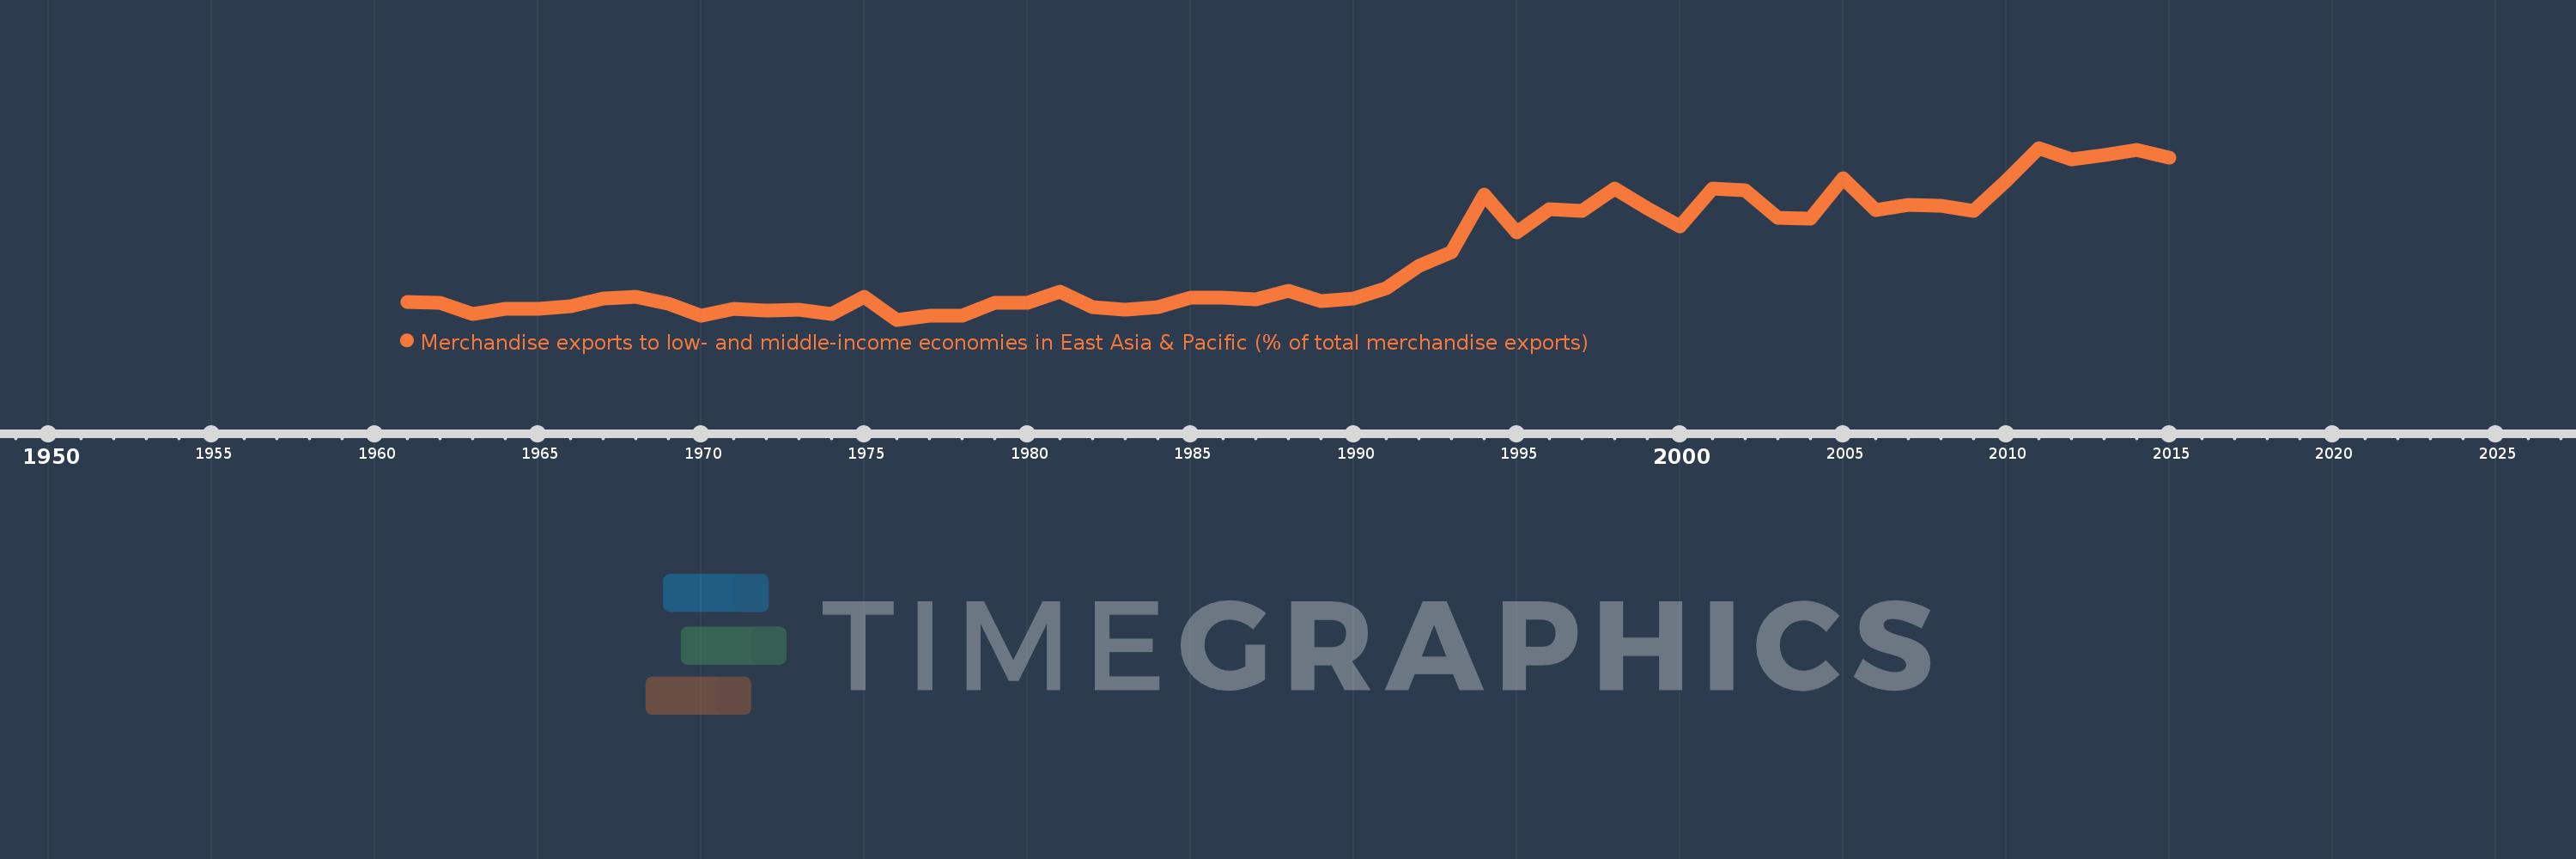
Merchandise exports to low- and middle-income economies in East Asia & Pacific (% of total merchandise exports)
2015,2014,2013,2012,2011,2010,2009,2008,2007,2006,2005,2004,2003,2002,2001,2000,1999,1998,1997,1996,1995,1994,1993,1992,1991,1990,1989,1988,1987,1986,1985,1984,1983,1982,1981,1980,1979,1978,1977,1976,1975,1974,1973,1972,1971,1970,1969,1968,1967,1966,1965,1964,1963,1962,1961
This statistics in other country:
AfghanistanAlbaniaAlgeriaArab WorldArgentinaAustraliaAustriaAzerbaijanBahamas, TheBahrainBangladeshBarbadosBelarusBelgiumBermudaBrazilBrunei DarussalamBulgariaCabo VerdeCambodiaCameroonCanadaCaribbean small statesCentral Europe and the BalticsChileChinaColombiaCosta RicaCote d'IvoireCroatiaCubaCyprusCzech RepublicDenmarkDominicaDominican RepublicEarly-demographic dividendEast Asia & PacificEast Asia & Pacific (excluding high income)East Asia & Pacific (IDA & IBRD countries)EcuadorEgypt, Arab Rep.El SalvadorEstoniaEthiopiaEuro areaEurope & Central AsiaEurope & Central Asia (excluding high income)Europe & Central Asia (IDA & IBRD countries)European UnionFijiFinlandFragile and conflict affected situationsFranceGermanyGhanaGreeceGuatemalaGuyanaHeavily indebted poor countries (HIPC)High incomeHondurasHong Kong SAR, ChinaHungaryIBRD onlyIcelandIDA & IBRD totalIDA blendIDA onlyIDA totalIndiaIndonesiaIran, Islamic Rep.IraqIrelandIsraelItalyJamaicaJapanJordanKazakhstanKenyaKorea, Dem. People’s Rep.Korea, Rep.KuwaitLate-demographic dividendLatin America & Caribbean Latin America & Caribbean (excluding high income)Latin America & the Caribbean (IDA & IBRD countries)LatviaLeast developed countries: UN classificationLebanonLithuaniaLow & middle incomeLow incomeLower middle incomeLuxembourgMacao SAR, ChinaMacedonia, FYRMadagascarMalaysiaMaltaMauritiusMexicoMiddle East & North AfricaMiddle East & North Africa (excluding high income)Middle East & North Africa (IDA & IBRD countries)Middle incomeMoldovaMontenegroMoroccoMozambiqueMyanmarNetherlandsNew CaledoniaNew ZealandNigeriaNorth AmericaNorwayOECD membersOmanOther small statesPacific island small statesPakistanPapua New GuineaParaguayPeruPhilippinesPolandPortugalPost-demographic dividendPre-demographic dividendQatarRomaniaRussian FederationSaudi ArabiaSenegalSerbiaSingaporeSlovak RepublicSloveniaSmall statesSolomon IslandsSomaliaSouth AfricaSouth AsiaSouth Asia (IDA & IBRD)SpainSri LankaSt. LuciaSub-Saharan Africa Sub-Saharan Africa (excluding high income)Sub-Saharan Africa (IDA & IBRD countries)SurinameSwedenSwitzerlandSyrian Arab RepublicTanzaniaThailandTogoTongaTrinidad and TobagoTunisiaTurkeyUgandaUkraineUnited Arab EmiratesUnited KingdomUnited StatesUpper middle incomeVenezuela, RBVietnamWorldYemen, Rep.ZambiaZimbabwe Timeline:
This timeline shows a graph from 1961 to 2015 of Finland. No data until 1960. Number of actual observations by date: 55.
Source name:
World Development Indicators
Source organization:
World Bank staff estimates based data from International Monetary Fund's Direction of Trade database.
Categories, topics:
Private Sector, Trade
Last updated:
apr 23, 2017
Indicators value changes by year
At the date of observation
Value
Absolute change
Change from previous value
jan 1, 1961
1.012
+1.012
0.0%
jan 1, 1962
0.997
-0.015
-1.47%
jan 1, 1963
0.598
-0.399
-39.99%
jan 1, 1964
0.775
+0.176
29.46%
jan 1, 1965
0.775
+0.001
0.1%
jan 1, 1966
0.87
+0.094
12.14%
jan 1, 1967
1.123
+0.253
29.08%
jan 1, 1968
1.2
+0.077
6.88%
jan 1, 1969
0.954
-0.246
-20.47%
jan 1, 1970
0.559
-0.396
-41.45%
jan 1, 1971
0.775
+0.217
38.75%
jan 1, 1972
0.72
-0.055
-7.15%
jan 1, 1973
0.765
+0.045
6.2%
jan 1, 1974
0.617
-0.147
-19.25%
jan 1, 1975
1.19
+0.573
92.74%
jan 1, 1976
0.408
-0.782
-65.69%
jan 1, 1977
0.555
+0.147
35.94%
jan 1, 1978
0.56
+0.005
0.94%
jan 1, 1979
0.976
+0.415
74.14%
jan 1, 1980
0.973
-0.003
-0.31%
jan 1, 1981
1.368
+0.395
40.62%
jan 1, 1982
0.854
-0.513
-37.54%
jan 1, 1983
0.762
-0.093
-10.85%
jan 1, 1984
0.84
+0.079
10.31%
jan 1, 1985
1.166
+0.326
38.84%
jan 1, 1986
1.155
-0.012
-0.99%
jan 1, 1987
1.106
-0.049
-4.28%
jan 1, 1988
1.407
+0.301
27.26%
jan 1, 1989
1.059
-0.348
-24.7%
jan 1, 1990
1.123
+0.063
5.97%
jan 1, 1991
1.481
+0.358
31.87%
jan 1, 1992
2.257
+0.776
52.44%
jan 1, 1993
2.716
+0.46
20.37%
jan 1, 1994
4.679
+1.963
72.25%
jan 1, 1995
3.393
-1.287
-27.49%
jan 1, 1996
4.19
+0.798
23.51%
jan 1, 1997
4.133
-0.057
-1.36%
jan 1, 1998
4.902
+0.769
18.6%
jan 1, 1999
4.211
-0.691
-14.09%
jan 1, 2000
3.592
-0.62
-14.72%
jan 1, 2001
4.891
+1.299
36.17%
jan 1, 2002
4.836
-0.055
-1.12%
jan 1, 2003
3.898
-0.938
-19.4%
jan 1, 2004
3.869
-0.028
-0.73%
jan 1, 2005
5.249
+1.379
35.65%
jan 1, 2006
4.164
-1.085
-20.66%
jan 1, 2007
4.33
+0.166
3.99%
jan 1, 2008
4.315
-0.015
-0.36%
jan 1, 2009
4.138
-0.177
-4.1%
jan 1, 2010
5.168
+1.03
24.89%
jan 1, 2011
6.284
+1.115
21.58%
jan 1, 2012
5.898
-0.385
-6.13%
jan 1, 2013
6.045
+0.147
2.49%
jan 1, 2014
6.23
+0.185
3.06%
jan 1, 2015
5.95
-0.28
-4.49%
Ranking of countries by current statistics by years


Comments: