29
/
en
AIzaSyAYiBZKx7MnpbEhh9jyipgxe19OcubqV5w
April 1, 2024
44428
Least developed countries: UN classification
LDC
false
2
1
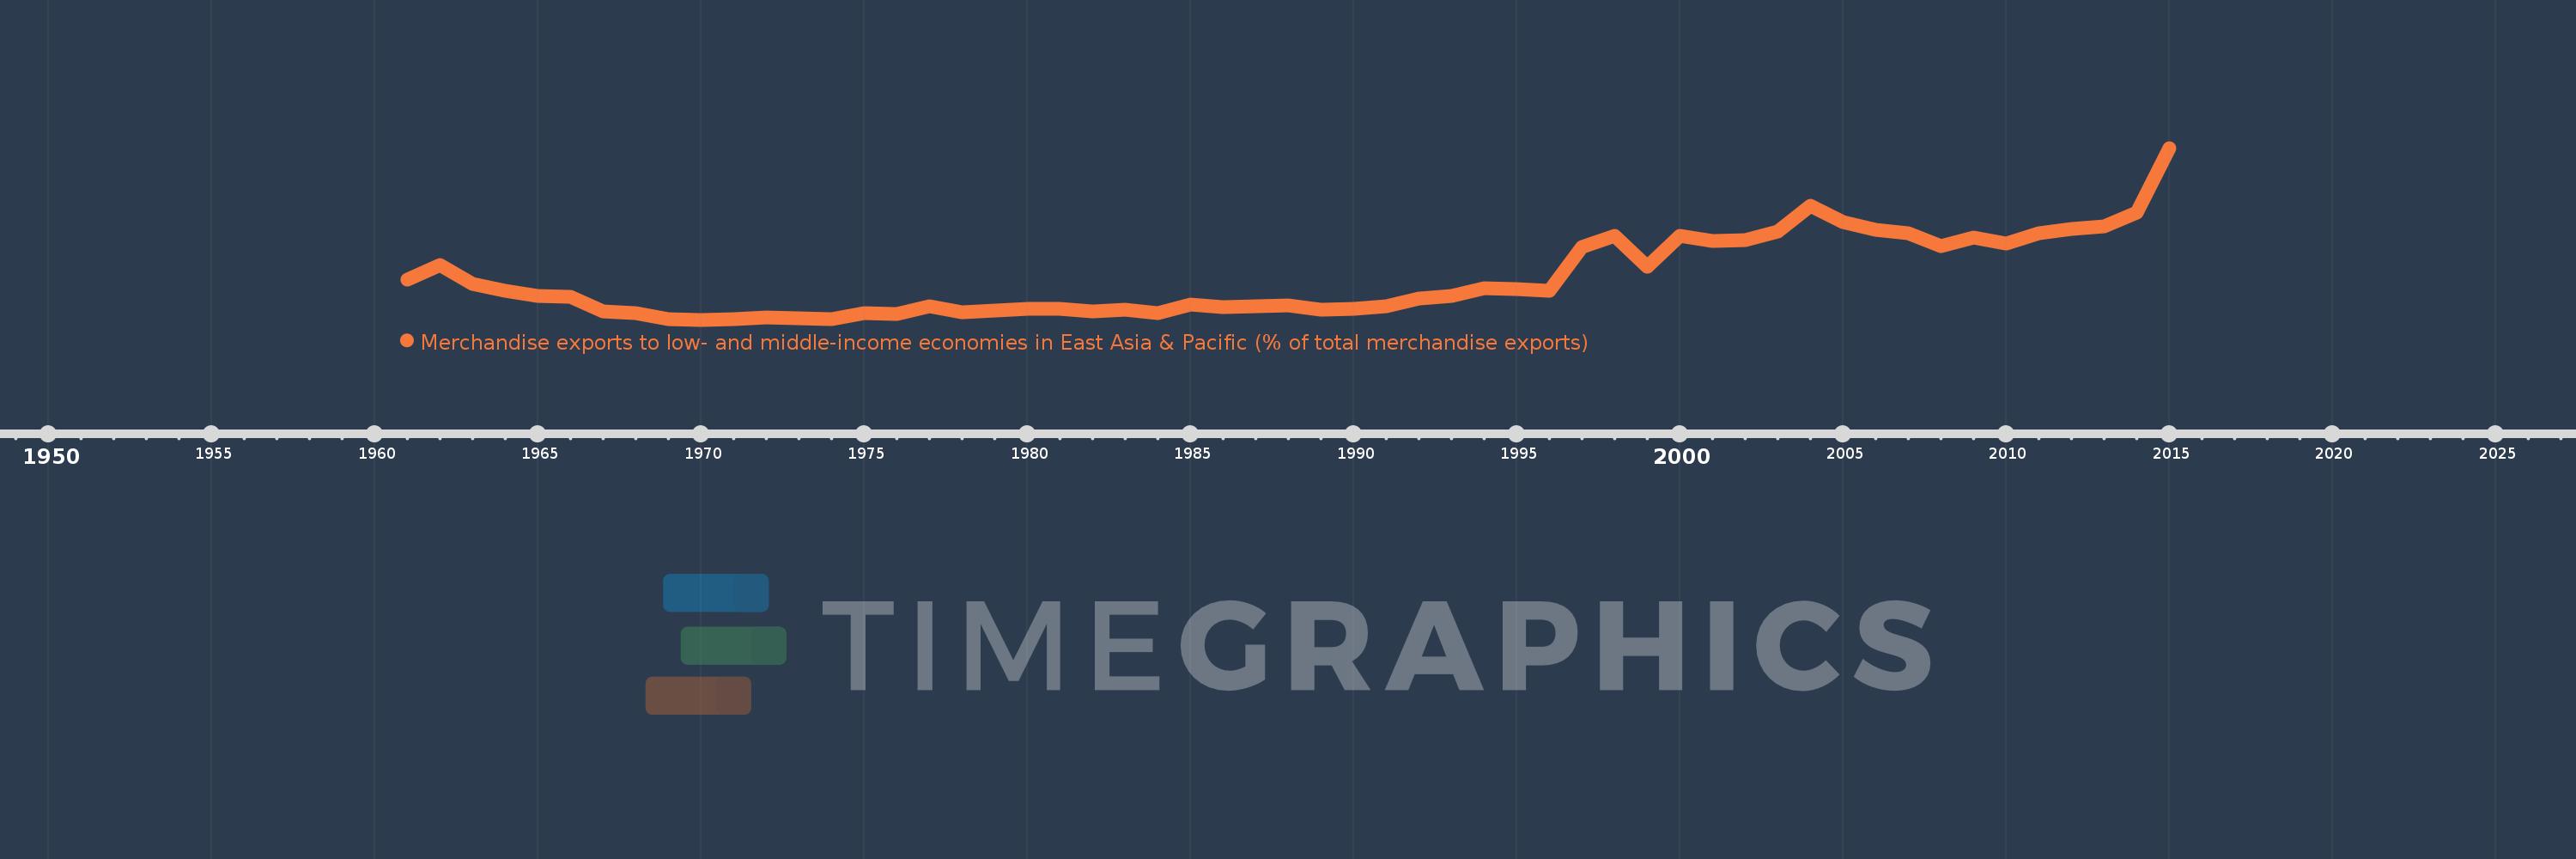
Merchandise exports to low- and middle-income economies in East Asia & Pacific (% of total merchandise exports)
2015,2014,2013,2012,2011,2010,2009,2008,2007,2006,2005,2004,2003,2002,2001,2000,1999,1998,1997,1996,1995,1994,1993,1992,1991,1990,1989,1988,1987,1986,1985,1984,1983,1982,1981,1980,1979,1978,1977,1976,1975,1974,1973,1972,1971,1970,1969,1968,1967,1966,1965,1964,1963,1962,1961
This statistics in other country:
AfghanistanAlbaniaAlgeriaArab WorldArgentinaAustraliaAustriaAzerbaijanBahamas, TheBahrainBangladeshBarbadosBelarusBelgiumBermudaBrazilBrunei DarussalamBulgariaCabo VerdeCambodiaCameroonCanadaCaribbean small statesCentral Europe and the BalticsChileChinaColombiaCosta RicaCote d'IvoireCroatiaCubaCyprusCzech RepublicDenmarkDominicaDominican RepublicEarly-demographic dividendEast Asia & PacificEast Asia & Pacific (excluding high income)East Asia & Pacific (IDA & IBRD countries)EcuadorEgypt, Arab Rep.El SalvadorEstoniaEthiopiaEuro areaEurope & Central AsiaEurope & Central Asia (excluding high income)Europe & Central Asia (IDA & IBRD countries)European UnionFijiFinlandFragile and conflict affected situationsFranceGermanyGhanaGreeceGuatemalaGuyanaHeavily indebted poor countries (HIPC)High incomeHondurasHong Kong SAR, ChinaHungaryIBRD onlyIcelandIDA & IBRD totalIDA blendIDA onlyIDA totalIndiaIndonesiaIran, Islamic Rep.IraqIrelandIsraelItalyJamaicaJapanJordanKazakhstanKenyaKorea, Dem. People’s Rep.Korea, Rep.KuwaitLate-demographic dividendLatin America & Caribbean Latin America & Caribbean (excluding high income)Latin America & the Caribbean (IDA & IBRD countries)LatviaLeast developed countries: UN classificationLebanonLithuaniaLow & middle incomeLow incomeLower middle incomeLuxembourgMacao SAR, ChinaMacedonia, FYRMadagascarMalaysiaMaltaMauritiusMexicoMiddle East & North AfricaMiddle East & North Africa (excluding high income)Middle East & North Africa (IDA & IBRD countries)Middle incomeMoldovaMontenegroMoroccoMozambiqueMyanmarNetherlandsNew CaledoniaNew ZealandNigeriaNorth AmericaNorwayOECD membersOmanOther small statesPacific island small statesPakistanPapua New GuineaParaguayPeruPhilippinesPolandPortugalPost-demographic dividendPre-demographic dividendQatarRomaniaRussian FederationSaudi ArabiaSenegalSerbiaSingaporeSlovak RepublicSloveniaSmall statesSolomon IslandsSomaliaSouth AfricaSouth AsiaSouth Asia (IDA & IBRD)SpainSri LankaSt. LuciaSub-Saharan Africa Sub-Saharan Africa (excluding high income)Sub-Saharan Africa (IDA & IBRD countries)SurinameSwedenSwitzerlandSyrian Arab RepublicTanzaniaThailandTogoTongaTrinidad and TobagoTunisiaTurkeyUgandaUkraineUnited Arab EmiratesUnited KingdomUnited StatesUpper middle incomeVenezuela, RBVietnamWorldYemen, Rep.ZambiaZimbabwe Timeline:
This timeline shows a graph from 1961 to 2015 of Least developed countries: UN classification. No data until 1960. Number of actual observations by date: 55.
Source name:
World Development Indicators
Source organization:
World Bank staff estimates based data from International Monetary Fund's Direction of Trade database.
Categories, topics:
Private Sector, Trade
Last updated:
apr 23, 2017
Indicators value changes by year
Maximum:
14.248
jan 1, 2015
At the date of observation
Value
Absolute change
Change from previous value
jan 1, 1961
3.465
+3.465
0.0%
jan 1, 1962
4.664
+1.199
34.6%
jan 1, 1963
3.113
-1.551
-33.26%
jan 1, 1964
2.598
-0.514
-16.52%
jan 1, 1965
2.146
-0.452
-17.41%
jan 1, 1966
2.081
-0.065
-3.05%
jan 1, 1967
0.926
-1.154
-55.47%
jan 1, 1968
0.771
-0.155
-16.73%
jan 1, 1969
0.3
-0.472
-61.13%
jan 1, 1970
0.221
-0.079
-26.4%
jan 1, 1971
0.286
+0.065
29.62%
jan 1, 1972
0.407
+0.121
42.19%
jan 1, 1973
0.315
-0.092
-22.53%
jan 1, 1974
0.246
-0.07
-22.07%
jan 1, 1975
0.727
+0.482
196.26%
jan 1, 1976
0.7
-0.027
-3.71%
jan 1, 1977
1.309
+0.608
86.83%
jan 1, 1978
0.843
-0.465
-35.55%
jan 1, 1979
0.951
+0.108
12.78%
jan 1, 1980
1.135
+0.183
19.27%
jan 1, 1981
1.131
-0.004
-0.35%
jan 1, 1982
0.872
-0.259
-22.87%
jan 1, 1983
1.035
+0.163
18.7%
jan 1, 1984
0.767
-0.268
-25.91%
jan 1, 1985
1.456
+0.689
89.86%
jan 1, 1986
1.217
-0.239
-16.4%
jan 1, 1987
1.312
+0.095
7.76%
jan 1, 1988
1.373
+0.061
4.68%
jan 1, 1989
1.063
-0.31
-22.57%
jan 1, 1990
1.11
+0.047
4.41%
jan 1, 1991
1.309
+0.199
17.89%
jan 1, 1992
1.982
+0.673
51.42%
jan 1, 1993
2.13
+0.149
7.5%
jan 1, 1994
2.791
+0.66
31.0%
jan 1, 1995
2.703
-0.088
-3.16%
jan 1, 1996
2.605
-0.097
-3.6%
jan 1, 1997
6.149
+3.544
136.01%
jan 1, 1998
7.078
+0.929
15.12%
jan 1, 1999
4.535
-2.543
-35.93%
jan 1, 2000
7.057
+2.522
55.6%
jan 1, 2001
6.646
-0.411
-5.82%
jan 1, 2002
6.751
+0.105
1.59%
jan 1, 2003
7.422
+0.671
9.94%
jan 1, 2004
9.514
+2.092
28.18%
jan 1, 2005
8.205
-1.309
-13.76%
jan 1, 2006
7.574
-0.631
-7.69%
jan 1, 2007
7.303
-0.271
-3.58%
jan 1, 2008
6.237
-1.065
-14.59%
jan 1, 2009
6.922
+0.685
10.99%
jan 1, 2010
6.444
-0.478
-6.9%
jan 1, 2011
7.249
+0.805
12.48%
jan 1, 2012
7.661
+0.412
5.69%
jan 1, 2013
7.845
+0.183
2.39%
jan 1, 2014
8.954
+1.109
14.14%
jan 1, 2015
14.248
+5.294
59.13%
Ranking of countries by current statistics by years


Comments: