29
/
en
AIzaSyAYiBZKx7MnpbEhh9jyipgxe19OcubqV5w
April 1, 2024
119155
Denmark
DNK
true
2
1
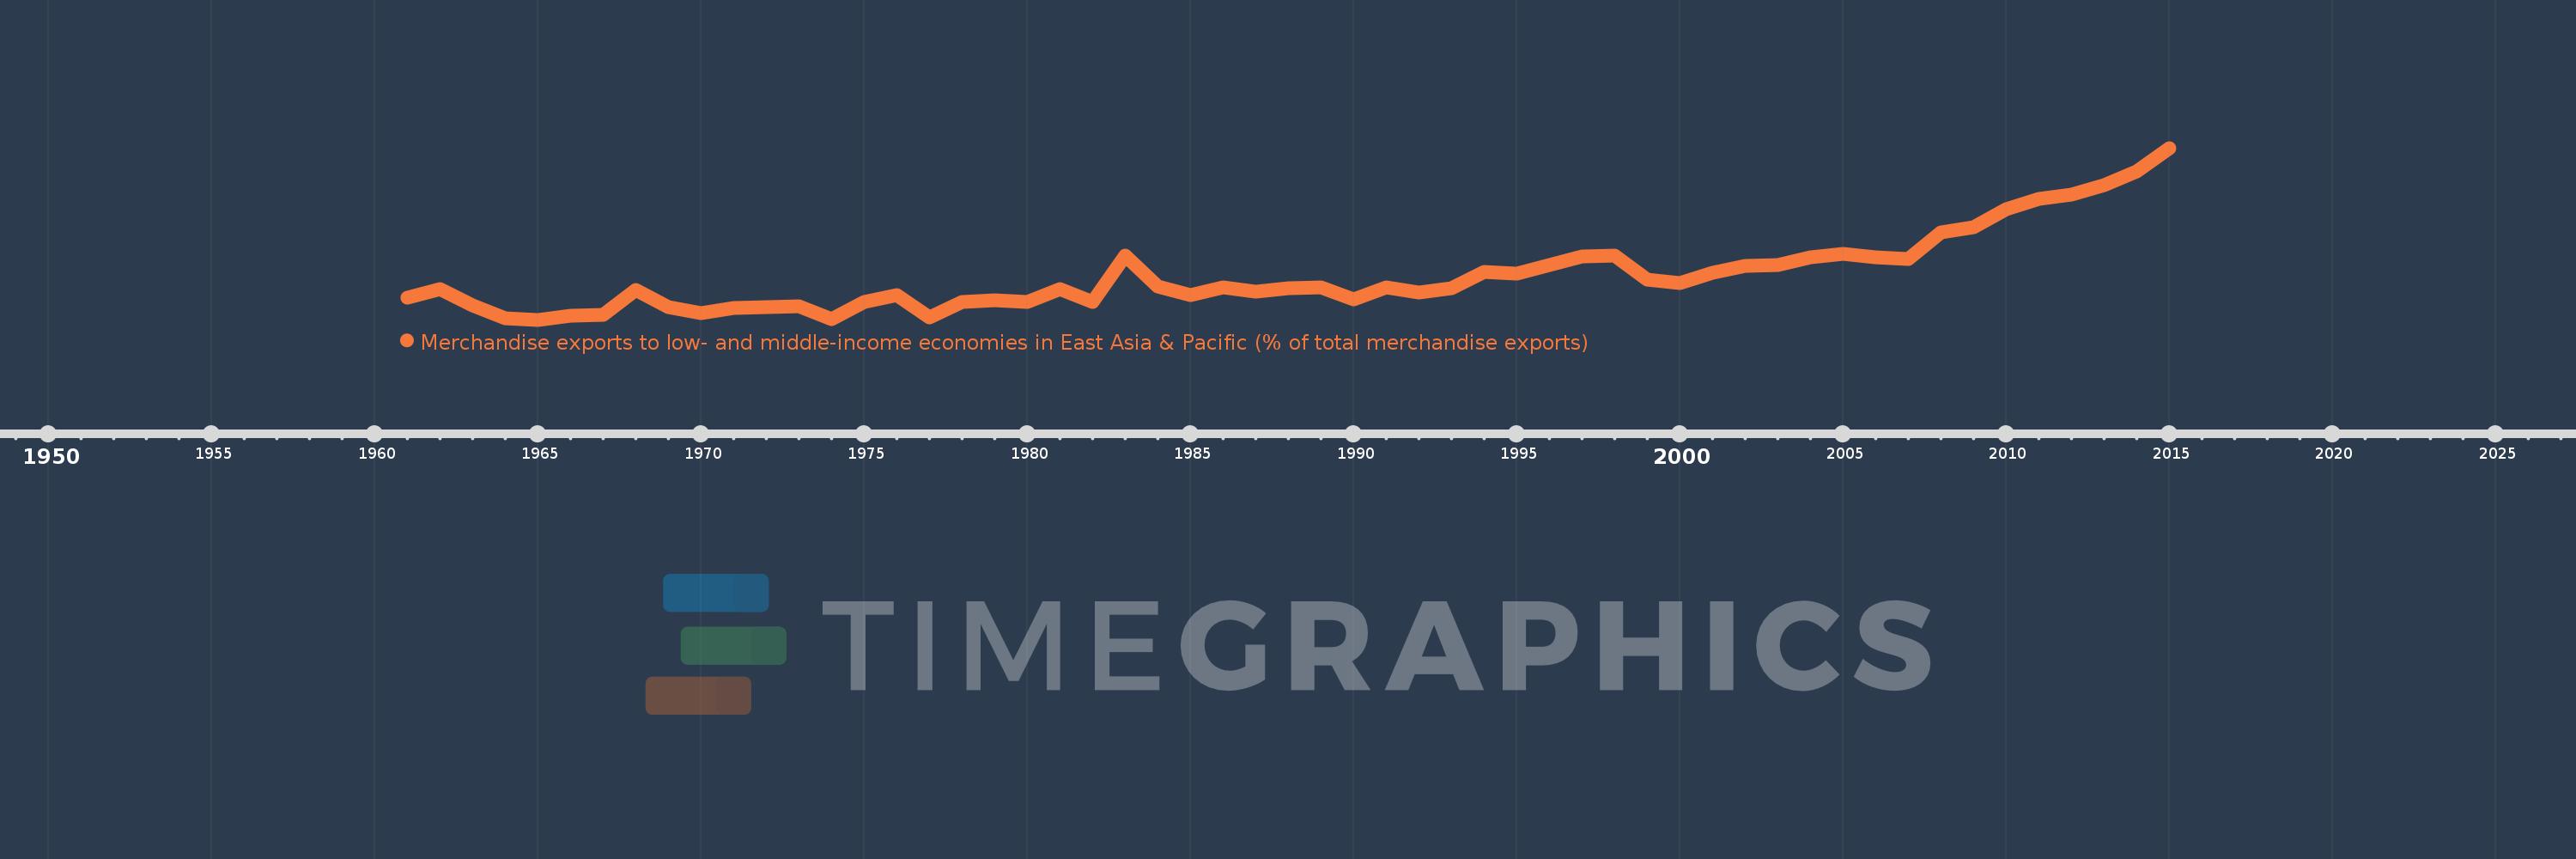
Merchandise exports to low- and middle-income economies in East Asia & Pacific (% of total merchandise exports)
2015,2014,2013,2012,2011,2010,2009,2008,2007,2006,2005,2004,2003,2002,2001,2000,1999,1998,1997,1996,1995,1994,1993,1992,1991,1990,1989,1988,1987,1986,1985,1984,1983,1982,1981,1980,1979,1978,1977,1976,1975,1974,1973,1972,1971,1970,1969,1968,1967,1966,1965,1964,1963,1962,1961
This statistics in other country:
AfghanistanAlbaniaAlgeriaArab WorldArgentinaAustraliaAustriaAzerbaijanBahamas, TheBahrainBangladeshBarbadosBelarusBelgiumBermudaBrazilBrunei DarussalamBulgariaCabo VerdeCambodiaCameroonCanadaCaribbean small statesCentral Europe and the BalticsChileChinaColombiaCosta RicaCote d'IvoireCroatiaCubaCyprusCzech RepublicDenmarkDominicaDominican RepublicEarly-demographic dividendEast Asia & PacificEast Asia & Pacific (excluding high income)East Asia & Pacific (IDA & IBRD countries)EcuadorEgypt, Arab Rep.El SalvadorEstoniaEthiopiaEuro areaEurope & Central AsiaEurope & Central Asia (excluding high income)Europe & Central Asia (IDA & IBRD countries)European UnionFijiFinlandFragile and conflict affected situationsFranceGermanyGhanaGreeceGuatemalaGuyanaHeavily indebted poor countries (HIPC)High incomeHondurasHong Kong SAR, ChinaHungaryIBRD onlyIcelandIDA & IBRD totalIDA blendIDA onlyIDA totalIndiaIndonesiaIran, Islamic Rep.IraqIrelandIsraelItalyJamaicaJapanJordanKazakhstanKenyaKorea, Dem. People’s Rep.Korea, Rep.KuwaitLate-demographic dividendLatin America & Caribbean Latin America & Caribbean (excluding high income)Latin America & the Caribbean (IDA & IBRD countries)LatviaLeast developed countries: UN classificationLebanonLithuaniaLow & middle incomeLow incomeLower middle incomeLuxembourgMacao SAR, ChinaMacedonia, FYRMadagascarMalaysiaMaltaMauritiusMexicoMiddle East & North AfricaMiddle East & North Africa (excluding high income)Middle East & North Africa (IDA & IBRD countries)Middle incomeMoldovaMontenegroMoroccoMozambiqueMyanmarNetherlandsNew CaledoniaNew ZealandNigeriaNorth AmericaNorwayOECD membersOmanOther small statesPacific island small statesPakistanPapua New GuineaParaguayPeruPhilippinesPolandPortugalPost-demographic dividendPre-demographic dividendQatarRomaniaRussian FederationSaudi ArabiaSenegalSerbiaSingaporeSlovak RepublicSloveniaSmall statesSolomon IslandsSomaliaSouth AfricaSouth AsiaSouth Asia (IDA & IBRD)SpainSri LankaSt. LuciaSub-Saharan Africa Sub-Saharan Africa (excluding high income)Sub-Saharan Africa (IDA & IBRD countries)SurinameSwedenSwitzerlandSyrian Arab RepublicTanzaniaThailandTogoTongaTrinidad and TobagoTunisiaTurkeyUgandaUkraineUnited Arab EmiratesUnited KingdomUnited StatesUpper middle incomeVenezuela, RBVietnamWorldYemen, Rep.ZambiaZimbabwe Timeline:
This timeline shows a graph from 1961 to 2015 of Denmark. No data until 1960. Number of actual observations by date: 55.
Source name:
World Development Indicators
Source organization:
World Bank staff estimates based data from International Monetary Fund's Direction of Trade database.
Categories, topics:
Private Sector, Trade
Last updated:
apr 23, 2017
Indicators value changes by year
At the date of observation
Value
Absolute change
Change from previous value
jan 1, 1961
1.019
+1.019
0.0%
jan 1, 1962
1.206
+0.187
18.34%
jan 1, 1963
0.846
-0.36
-29.84%
jan 1, 1964
0.563
-0.283
-33.41%
jan 1, 1965
0.535
-0.028
-5.03%
jan 1, 1966
0.618
+0.083
15.49%
jan 1, 1967
0.641
+0.023
3.73%
jan 1, 1968
1.198
+0.557
86.91%
jan 1, 1969
0.817
-0.381
-31.78%
jan 1, 1970
0.687
-0.13
-15.91%
jan 1, 1971
0.797
+0.11
15.98%
jan 1, 1972
0.813
+0.016
1.97%
jan 1, 1973
0.829
+0.017
2.04%
jan 1, 1974
0.556
-0.273
-32.94%
jan 1, 1975
0.923
+0.367
66.03%
jan 1, 1976
1.072
+0.149
16.19%
jan 1, 1977
0.593
-0.48
-44.71%
jan 1, 1978
0.929
+0.336
56.73%
jan 1, 1979
0.959
+0.03
3.19%
jan 1, 1980
0.928
-0.031
-3.21%
jan 1, 1981
1.221
+0.293
31.57%
jan 1, 1982
0.921
-0.301
-24.61%
jan 1, 1983
1.947
+1.026
111.43%
jan 1, 1984
1.277
-0.67
-34.41%
jan 1, 1985
1.089
-0.188
-14.73%
jan 1, 1986
1.252
+0.163
14.97%
jan 1, 1987
1.157
-0.095
-7.59%
jan 1, 1988
1.234
+0.078
6.71%
jan 1, 1989
1.248
+0.013
1.08%
jan 1, 1990
0.993
-0.254
-20.38%
jan 1, 1991
1.246
+0.253
25.47%
jan 1, 1992
1.144
-0.102
-8.19%
jan 1, 1993
1.236
+0.091
7.97%
jan 1, 1994
1.597
+0.361
29.21%
jan 1, 1995
1.548
-0.048
-3.02%
jan 1, 1996
1.74
+0.192
12.4%
jan 1, 1997
1.933
+0.193
11.09%
jan 1, 1998
1.947
+0.013
0.69%
jan 1, 1999
1.421
-0.525
-26.99%
jan 1, 2000
1.347
-0.074
-5.2%
jan 1, 2001
1.584
+0.237
17.58%
jan 1, 2002
1.724
+0.14
8.81%
jan 1, 2003
1.74
+0.016
0.95%
jan 1, 2004
1.909
+0.169
9.71%
jan 1, 2005
1.993
+0.084
4.38%
jan 1, 2006
1.909
-0.084
-4.19%
jan 1, 2007
1.888
-0.021
-1.12%
jan 1, 2008
2.465
+0.577
30.58%
jan 1, 2009
2.584
+0.119
4.82%
jan 1, 2010
2.979
+0.395
15.28%
jan 1, 2011
3.21
+0.231
7.74%
jan 1, 2012
3.301
+0.092
2.86%
jan 1, 2013
3.521
+0.219
6.65%
jan 1, 2014
3.82
+0.299
8.51%
jan 1, 2015
4.338
+0.518
13.57%
Ranking of countries by current statistics by years


Comments: