29
/
en
AIzaSyAYiBZKx7MnpbEhh9jyipgxe19OcubqV5w
April 1, 2024
42613
Latin America & Caribbean (excluding high income)
LAC
false
2
1
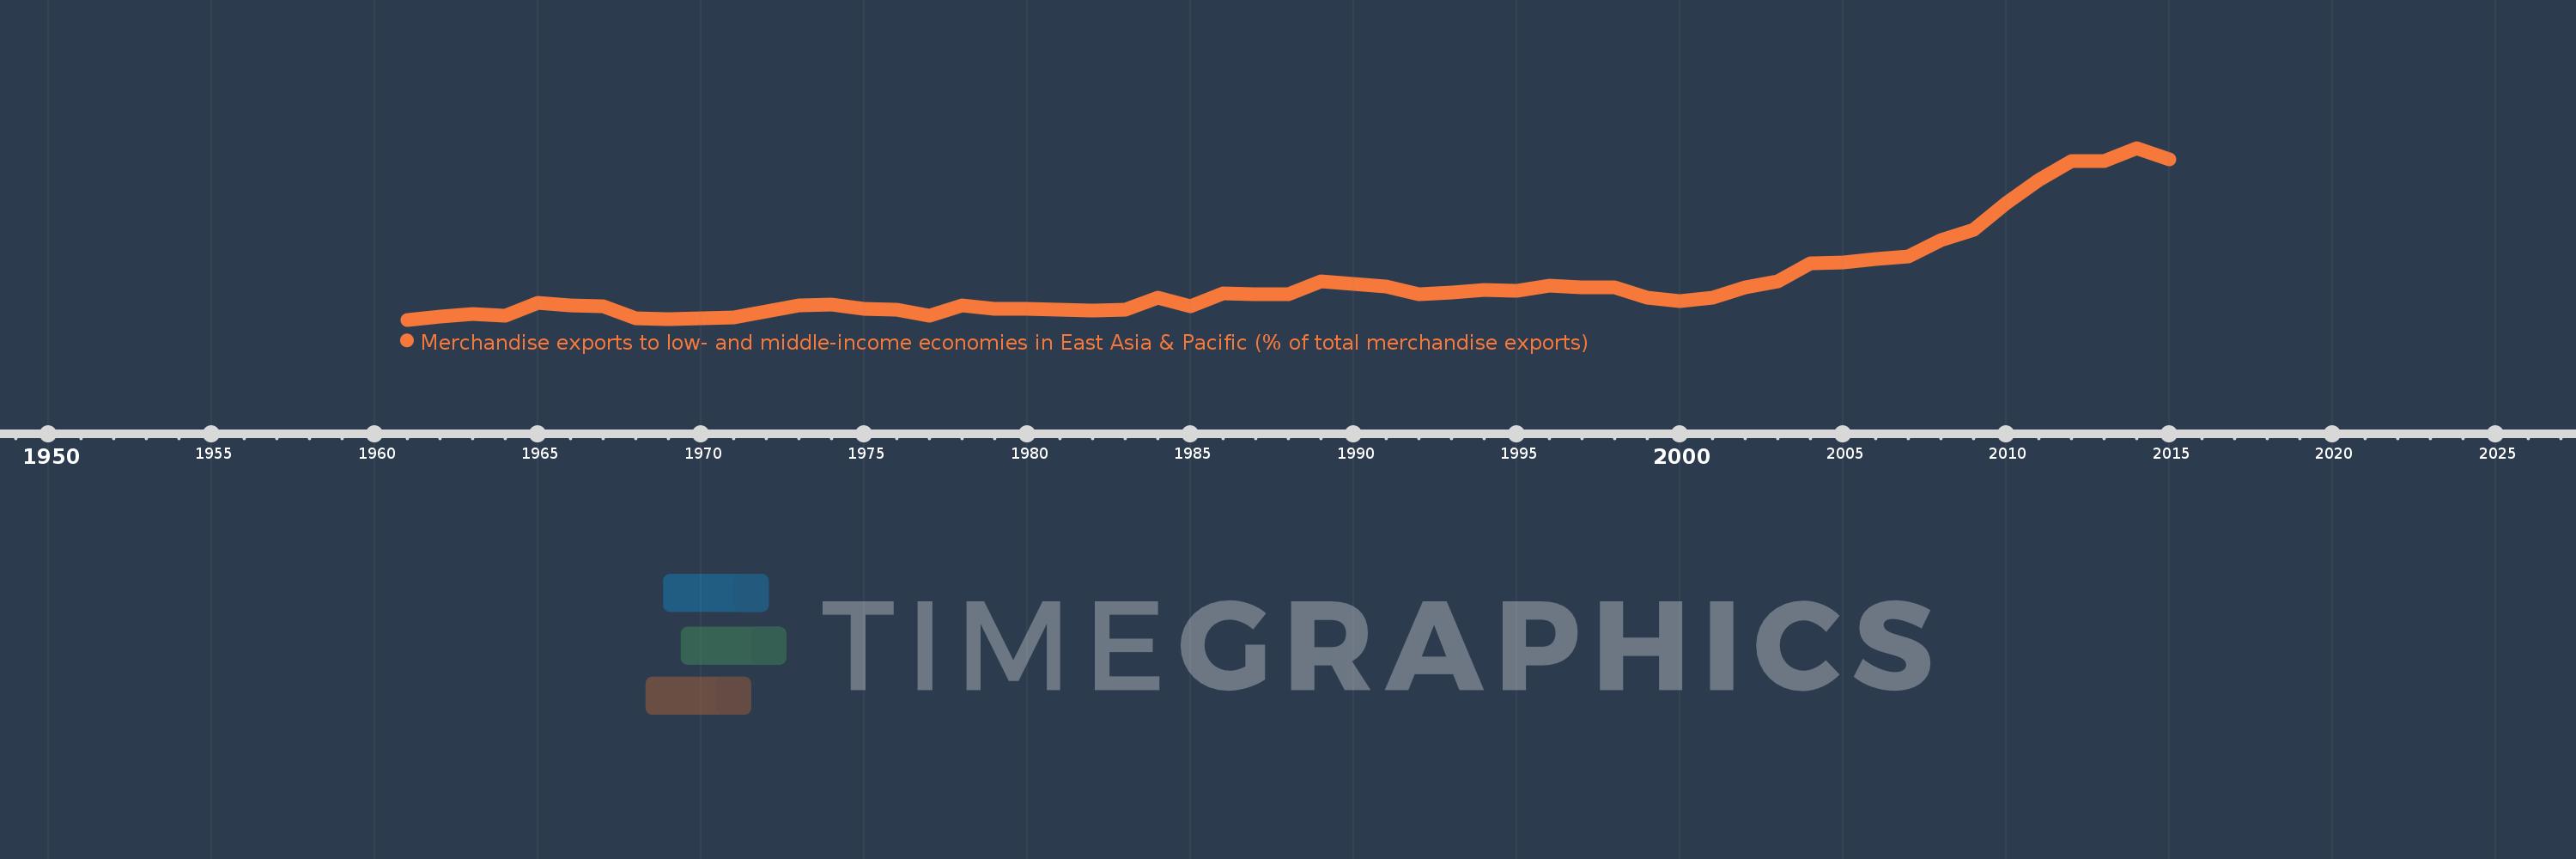
Merchandise exports to low- and middle-income economies in East Asia & Pacific (% of total merchandise exports)
2015,2014,2013,2012,2011,2010,2009,2008,2007,2006,2005,2004,2003,2002,2001,2000,1999,1998,1997,1996,1995,1994,1993,1992,1991,1990,1989,1988,1987,1986,1985,1984,1983,1982,1981,1980,1979,1978,1977,1976,1975,1974,1973,1972,1971,1970,1969,1968,1967,1966,1965,1964,1963,1962,1961
This statistics in other country:
AfghanistanAlbaniaAlgeriaArab WorldArgentinaAustraliaAustriaAzerbaijanBahamas, TheBahrainBangladeshBarbadosBelarusBelgiumBermudaBrazilBrunei DarussalamBulgariaCabo VerdeCambodiaCameroonCanadaCaribbean small statesCentral Europe and the BalticsChileChinaColombiaCosta RicaCote d'IvoireCroatiaCubaCyprusCzech RepublicDenmarkDominicaDominican RepublicEarly-demographic dividendEast Asia & PacificEast Asia & Pacific (excluding high income)East Asia & Pacific (IDA & IBRD countries)EcuadorEgypt, Arab Rep.El SalvadorEstoniaEthiopiaEuro areaEurope & Central AsiaEurope & Central Asia (excluding high income)Europe & Central Asia (IDA & IBRD countries)European UnionFijiFinlandFragile and conflict affected situationsFranceGermanyGhanaGreeceGuatemalaGuyanaHeavily indebted poor countries (HIPC)High incomeHondurasHong Kong SAR, ChinaHungaryIBRD onlyIcelandIDA & IBRD totalIDA blendIDA onlyIDA totalIndiaIndonesiaIran, Islamic Rep.IraqIrelandIsraelItalyJamaicaJapanJordanKazakhstanKenyaKorea, Dem. People’s Rep.Korea, Rep.KuwaitLate-demographic dividendLatin America & Caribbean Latin America & Caribbean (excluding high income)Latin America & the Caribbean (IDA & IBRD countries)LatviaLeast developed countries: UN classificationLebanonLithuaniaLow & middle incomeLow incomeLower middle incomeLuxembourgMacao SAR, ChinaMacedonia, FYRMadagascarMalaysiaMaltaMauritiusMexicoMiddle East & North AfricaMiddle East & North Africa (excluding high income)Middle East & North Africa (IDA & IBRD countries)Middle incomeMoldovaMontenegroMoroccoMozambiqueMyanmarNetherlandsNew CaledoniaNew ZealandNigeriaNorth AmericaNorwayOECD membersOmanOther small statesPacific island small statesPakistanPapua New GuineaParaguayPeruPhilippinesPolandPortugalPost-demographic dividendPre-demographic dividendQatarRomaniaRussian FederationSaudi ArabiaSenegalSerbiaSingaporeSlovak RepublicSloveniaSmall statesSolomon IslandsSomaliaSouth AfricaSouth AsiaSouth Asia (IDA & IBRD)SpainSri LankaSt. LuciaSub-Saharan Africa Sub-Saharan Africa (excluding high income)Sub-Saharan Africa (IDA & IBRD countries)SurinameSwedenSwitzerlandSyrian Arab RepublicTanzaniaThailandTogoTongaTrinidad and TobagoTunisiaTurkeyUgandaUkraineUnited Arab EmiratesUnited KingdomUnited StatesUpper middle incomeVenezuela, RBVietnamWorldYemen, Rep.ZambiaZimbabwe Timeline:
This timeline shows a graph from 1961 to 2015 of Latin America & Caribbean (excluding high income). No data until 1960. Number of actual observations by date: 55.
Source name:
World Development Indicators
Source organization:
World Bank staff estimates based data from International Monetary Fund's Direction of Trade database.
Categories, topics:
Private Sector, Trade
Last updated:
apr 23, 2017
Indicators value changes by year
At the date of observation
Value
Absolute change
Change from previous value
jan 1, 1961
0.058
+0.058
0.0%
jan 1, 1962
0.269
+0.212
367.74%
jan 1, 1963
0.389
+0.12
44.66%
jan 1, 1964
0.32
-0.069
-17.71%
jan 1, 1965
1.07
+0.749
233.85%
jan 1, 1966
0.906
-0.163
-15.28%
jan 1, 1967
0.876
-0.03
-3.3%
jan 1, 1968
0.151
-0.726
-82.79%
jan 1, 1969
0.105
-0.046
-30.17%
jan 1, 1970
0.148
+0.042
40.26%
jan 1, 1971
0.212
+0.065
43.72%
jan 1, 1972
0.575
+0.362
170.65%
jan 1, 1973
0.892
+0.318
55.26%
jan 1, 1974
0.949
+0.057
6.38%
jan 1, 1975
0.696
-0.253
-26.63%
jan 1, 1976
0.638
-0.058
-8.33%
jan 1, 1977
0.313
-0.325
-50.92%
jan 1, 1978
0.922
+0.609
194.3%
jan 1, 1979
0.72
-0.202
-21.89%
jan 1, 1980
0.72
+0.0
0.01%
jan 1, 1981
0.658
-0.062
-8.67%
jan 1, 1982
0.627
-0.031
-4.75%
jan 1, 1983
0.64
+0.014
2.18%
jan 1, 1984
1.379
+0.739
115.45%
jan 1, 1985
0.869
-0.51
-36.97%
jan 1, 1986
1.643
+0.773
88.92%
jan 1, 1987
1.579
-0.064
-3.89%
jan 1, 1988
1.59
+0.011
0.71%
jan 1, 1989
2.317
+0.727
45.75%
jan 1, 1990
2.154
-0.163
-7.03%
jan 1, 1991
1.999
-0.156
-7.23%
jan 1, 1992
1.542
-0.457
-22.85%
jan 1, 1993
1.656
+0.114
7.41%
jan 1, 1994
1.802
+0.146
8.83%
jan 1, 1995
1.793
-0.009
-0.5%
jan 1, 1996
2.065
+0.272
15.16%
jan 1, 1997
1.981
-0.084
-4.07%
jan 1, 1998
1.969
-0.013
-0.64%
jan 1, 1999
1.355
-0.614
-31.19%
jan 1, 2000
1.163
-0.192
-14.17%
jan 1, 2001
1.366
+0.203
17.47%
jan 1, 2002
1.955
+0.589
43.16%
jan 1, 2003
2.343
+0.387
19.8%
jan 1, 2004
3.421
+1.079
46.04%
jan 1, 2005
3.454
+0.033
0.97%
jan 1, 2006
3.648
+0.194
5.61%
jan 1, 2007
3.819
+0.171
4.69%
jan 1, 2008
4.772
+0.952
24.94%
jan 1, 2009
5.391
+0.62
12.99%
jan 1, 2010
6.932
+1.541
28.58%
jan 1, 2011
8.314
+1.382
19.94%
jan 1, 2012
9.434
+1.12
13.47%
jan 1, 2013
9.468
+0.034
0.36%
jan 1, 2014
10.22
+0.752
7.95%
jan 1, 2015
9.557
-0.663
-6.48%
Ranking of countries by current statistics by years


Comments: