29
/
en
AIzaSyAYiBZKx7MnpbEhh9jyipgxe19OcubqV5w
April 1, 2024
142065
Greece
GRC
true
2
1
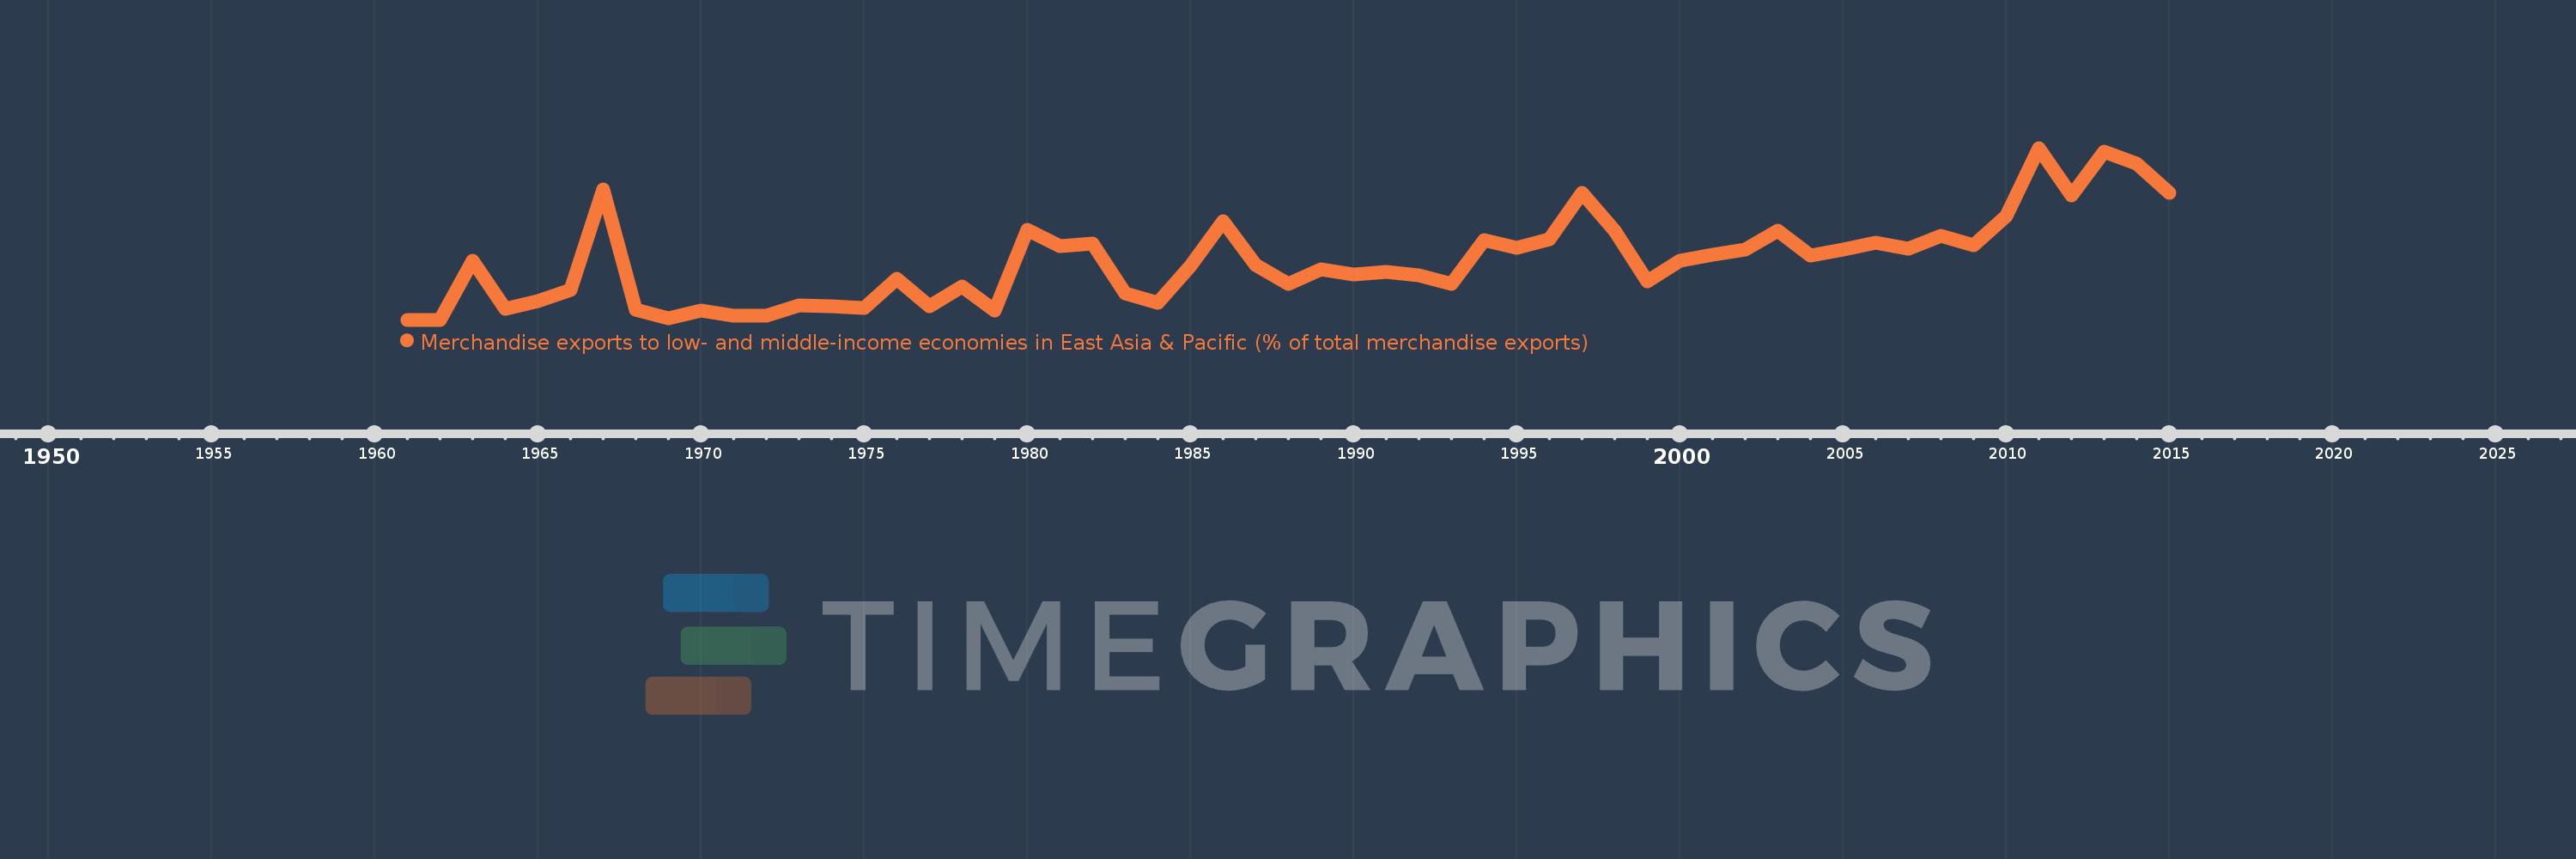
Merchandise exports to low- and middle-income economies in East Asia & Pacific (% of total merchandise exports)
2015,2014,2013,2012,2011,2010,2009,2008,2007,2006,2005,2004,2003,2002,2001,2000,1999,1998,1997,1996,1995,1994,1993,1992,1991,1990,1989,1988,1987,1986,1985,1984,1983,1982,1981,1980,1979,1978,1977,1976,1975,1974,1973,1972,1971,1970,1969,1968,1967,1966,1965,1964,1963,1962,1961
This statistics in other country:
AfghanistanAlbaniaAlgeriaArab WorldArgentinaAustraliaAustriaAzerbaijanBahamas, TheBahrainBangladeshBarbadosBelarusBelgiumBermudaBrazilBrunei DarussalamBulgariaCabo VerdeCambodiaCameroonCanadaCaribbean small statesCentral Europe and the BalticsChileChinaColombiaCosta RicaCote d'IvoireCroatiaCubaCyprusCzech RepublicDenmarkDominicaDominican RepublicEarly-demographic dividendEast Asia & PacificEast Asia & Pacific (excluding high income)East Asia & Pacific (IDA & IBRD countries)EcuadorEgypt, Arab Rep.El SalvadorEstoniaEthiopiaEuro areaEurope & Central AsiaEurope & Central Asia (excluding high income)Europe & Central Asia (IDA & IBRD countries)European UnionFijiFinlandFragile and conflict affected situationsFranceGermanyGhanaGreeceGuatemalaGuyanaHeavily indebted poor countries (HIPC)High incomeHondurasHong Kong SAR, ChinaHungaryIBRD onlyIcelandIDA & IBRD totalIDA blendIDA onlyIDA totalIndiaIndonesiaIran, Islamic Rep.IraqIrelandIsraelItalyJamaicaJapanJordanKazakhstanKenyaKorea, Dem. People’s Rep.Korea, Rep.KuwaitLate-demographic dividendLatin America & Caribbean Latin America & Caribbean (excluding high income)Latin America & the Caribbean (IDA & IBRD countries)LatviaLeast developed countries: UN classificationLebanonLithuaniaLow & middle incomeLow incomeLower middle incomeLuxembourgMacao SAR, ChinaMacedonia, FYRMadagascarMalaysiaMaltaMauritiusMexicoMiddle East & North AfricaMiddle East & North Africa (excluding high income)Middle East & North Africa (IDA & IBRD countries)Middle incomeMoldovaMontenegroMoroccoMozambiqueMyanmarNetherlandsNew CaledoniaNew ZealandNigeriaNorth AmericaNorwayOECD membersOmanOther small statesPacific island small statesPakistanPapua New GuineaParaguayPeruPhilippinesPolandPortugalPost-demographic dividendPre-demographic dividendQatarRomaniaRussian FederationSaudi ArabiaSenegalSerbiaSingaporeSlovak RepublicSloveniaSmall statesSolomon IslandsSomaliaSouth AfricaSouth AsiaSouth Asia (IDA & IBRD)SpainSri LankaSt. LuciaSub-Saharan Africa Sub-Saharan Africa (excluding high income)Sub-Saharan Africa (IDA & IBRD countries)SurinameSwedenSwitzerlandSyrian Arab RepublicTanzaniaThailandTogoTongaTrinidad and TobagoTunisiaTurkeyUgandaUkraineUnited Arab EmiratesUnited KingdomUnited StatesUpper middle incomeVenezuela, RBVietnamWorldYemen, Rep.ZambiaZimbabwe Timeline:
This timeline shows a graph from 1961 to 2015 of Greece. No data until 1960. Number of actual observations by date: 55.
Source name:
World Development Indicators
Source organization:
World Bank staff estimates based data from International Monetary Fund's Direction of Trade database.
Categories, topics:
Private Sector, Trade
Last updated:
apr 23, 2017
Indicators value changes by year
At the date of observation
Value
Absolute change
Change from previous value
jan 1, 1963
0.725
+0.725
%
jan 1, 1964
0.138
-0.587
-80.99%
jan 1, 1965
0.227
+0.089
64.51%
jan 1, 1966
0.366
+0.14
61.54%
jan 1, 1967
1.601
+1.235
337.07%
jan 1, 1968
0.121
-1.48
-92.43%
jan 1, 1969
0.021
-0.1
-82.38%
jan 1, 1970
0.116
+0.094
440.68%
jan 1, 1971
0.047
-0.069
-59.68%
jan 1, 1972
0.054
+0.008
16.61%
jan 1, 1973
0.172
+0.118
217.12%
jan 1, 1974
0.169
-0.003
-1.8%
jan 1, 1975
0.14
-0.029
-17.0%
jan 1, 1976
0.503
+0.363
258.41%
jan 1, 1977
0.166
-0.337
-67.0%
jan 1, 1978
0.412
+0.246
148.2%
jan 1, 1979
0.116
-0.296
-71.83%
jan 1, 1980
1.103
+0.987
849.96%
jan 1, 1981
0.902
-0.201
-18.26%
jan 1, 1982
0.942
+0.04
4.47%
jan 1, 1983
0.326
-0.616
-65.42%
jan 1, 1984
0.213
-0.113
-34.55%
jan 1, 1985
0.659
+0.445
208.83%
jan 1, 1986
1.218
+0.56
84.97%
jan 1, 1987
0.677
-0.541
-44.39%
jan 1, 1988
0.441
-0.237
-34.94%
jan 1, 1989
0.618
+0.177
40.17%
jan 1, 1990
0.559
-0.059
-9.51%
jan 1, 1991
0.593
+0.034
6.05%
jan 1, 1992
0.544
-0.049
-8.24%
jan 1, 1993
0.444
-0.1
-18.39%
jan 1, 1994
0.976
+0.531
119.7%
jan 1, 1995
0.886
-0.09
-9.19%
jan 1, 1996
0.991
+0.105
11.9%
jan 1, 1997
1.564
+0.573
57.79%
jan 1, 1998
1.095
-0.47
-30.02%
jan 1, 1999
0.47
-0.625
-57.06%
jan 1, 2000
0.732
+0.262
55.79%
jan 1, 2001
0.802
+0.069
9.45%
jan 1, 2002
0.865
+0.063
7.88%
jan 1, 2003
1.097
+0.232
26.85%
jan 1, 2004
0.789
-0.308
-28.06%
jan 1, 2005
0.861
+0.071
9.06%
jan 1, 2006
0.944
+0.083
9.69%
jan 1, 2007
0.876
-0.068
-7.22%
jan 1, 2008
1.033
+0.157
17.93%
jan 1, 2009
0.916
-0.117
-11.29%
jan 1, 2010
1.282
+0.366
39.93%
jan 1, 2011
2.116
+0.834
65.03%
jan 1, 2012
1.528
-0.588
-27.79%
jan 1, 2013
2.073
+0.545
35.7%
jan 1, 2014
1.923
-0.15
-7.23%
jan 1, 2015
1.567
-0.356
-18.53%
Ranking of countries by current statistics by years


Comments: