29
/
en
AIzaSyAYiBZKx7MnpbEhh9jyipgxe19OcubqV5w
April 1, 2024
256587
Sweden
SWE
true
2
1
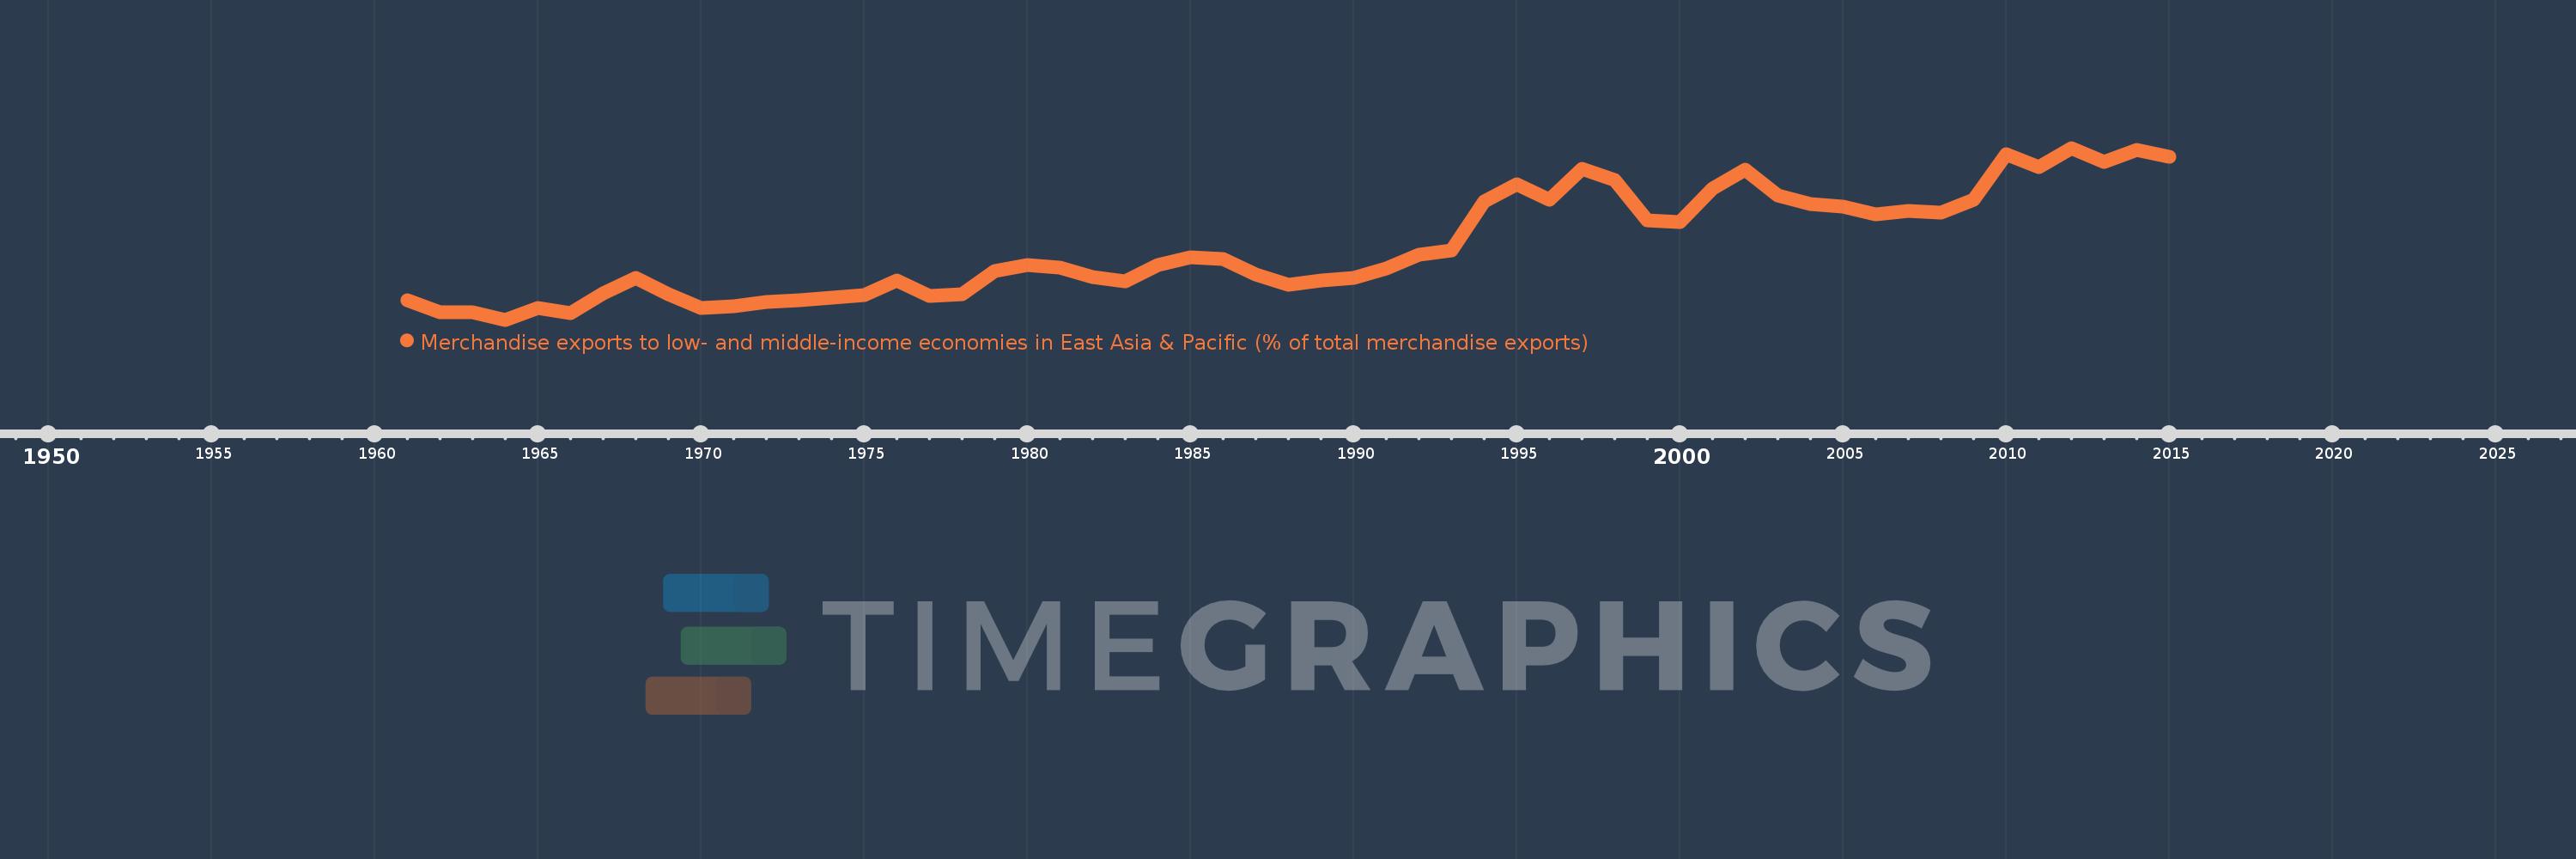
Merchandise exports to low- and middle-income economies in East Asia & Pacific (% of total merchandise exports)
2015,2014,2013,2012,2011,2010,2009,2008,2007,2006,2005,2004,2003,2002,2001,2000,1999,1998,1997,1996,1995,1994,1993,1992,1991,1990,1989,1988,1987,1986,1985,1984,1983,1982,1981,1980,1979,1978,1977,1976,1975,1974,1973,1972,1971,1970,1969,1968,1967,1966,1965,1964,1963,1962,1961
This statistics in other country:
AfghanistanAlbaniaAlgeriaArab WorldArgentinaAustraliaAustriaAzerbaijanBahamas, TheBahrainBangladeshBarbadosBelarusBelgiumBermudaBrazilBrunei DarussalamBulgariaCabo VerdeCambodiaCameroonCanadaCaribbean small statesCentral Europe and the BalticsChileChinaColombiaCosta RicaCote d'IvoireCroatiaCubaCyprusCzech RepublicDenmarkDominicaDominican RepublicEarly-demographic dividendEast Asia & PacificEast Asia & Pacific (excluding high income)East Asia & Pacific (IDA & IBRD countries)EcuadorEgypt, Arab Rep.El SalvadorEstoniaEthiopiaEuro areaEurope & Central AsiaEurope & Central Asia (excluding high income)Europe & Central Asia (IDA & IBRD countries)European UnionFijiFinlandFragile and conflict affected situationsFranceGermanyGhanaGreeceGuatemalaGuyanaHeavily indebted poor countries (HIPC)High incomeHondurasHong Kong SAR, ChinaHungaryIBRD onlyIcelandIDA & IBRD totalIDA blendIDA onlyIDA totalIndiaIndonesiaIran, Islamic Rep.IraqIrelandIsraelItalyJamaicaJapanJordanKazakhstanKenyaKorea, Dem. People’s Rep.Korea, Rep.KuwaitLate-demographic dividendLatin America & Caribbean Latin America & Caribbean (excluding high income)Latin America & the Caribbean (IDA & IBRD countries)LatviaLeast developed countries: UN classificationLebanonLithuaniaLow & middle incomeLow incomeLower middle incomeLuxembourgMacao SAR, ChinaMacedonia, FYRMadagascarMalaysiaMaltaMauritiusMexicoMiddle East & North AfricaMiddle East & North Africa (excluding high income)Middle East & North Africa (IDA & IBRD countries)Middle incomeMoldovaMontenegroMoroccoMozambiqueMyanmarNetherlandsNew CaledoniaNew ZealandNigeriaNorth AmericaNorwayOECD membersOmanOther small statesPacific island small statesPakistanPapua New GuineaParaguayPeruPhilippinesPolandPortugalPost-demographic dividendPre-demographic dividendQatarRomaniaRussian FederationSaudi ArabiaSenegalSerbiaSingaporeSlovak RepublicSloveniaSmall statesSolomon IslandsSomaliaSouth AfricaSouth AsiaSouth Asia (IDA & IBRD)SpainSri LankaSt. LuciaSub-Saharan Africa Sub-Saharan Africa (excluding high income)Sub-Saharan Africa (IDA & IBRD countries)SurinameSwedenSwitzerlandSyrian Arab RepublicTanzaniaThailandTogoTongaTrinidad and TobagoTunisiaTurkeyUgandaUkraineUnited Arab EmiratesUnited KingdomUnited StatesUpper middle incomeVenezuela, RBVietnamWorldYemen, Rep.ZambiaZimbabwe Timeline:
This timeline shows a graph from 1961 to 2015 of Sweden. No data until 1960. Number of actual observations by date: 55.
Source name:
World Development Indicators
Source organization:
World Bank staff estimates based data from International Monetary Fund's Direction of Trade database.
Categories, topics:
Private Sector, Trade
Last updated:
apr 23, 2017
Indicators value changes by year
At the date of observation
Value
Absolute change
Change from previous value
jan 1, 1961
0.992
+0.992
0.0%
jan 1, 1962
0.692
-0.3
-30.27%
jan 1, 1963
0.703
+0.012
1.69%
jan 1, 1964
0.52
-0.183
-26.01%
jan 1, 1965
0.811
+0.29
55.81%
jan 1, 1966
0.677
-0.134
-16.54%
jan 1, 1967
1.141
+0.464
68.65%
jan 1, 1968
1.53
+0.389
34.06%
jan 1, 1969
1.121
-0.408
-26.7%
jan 1, 1970
0.798
-0.323
-28.82%
jan 1, 1971
0.843
+0.045
5.7%
jan 1, 1972
0.94
+0.096
11.41%
jan 1, 1973
0.981
+0.041
4.37%
jan 1, 1974
1.048
+0.067
6.87%
jan 1, 1975
1.099
+0.051
4.83%
jan 1, 1976
1.466
+0.368
33.46%
jan 1, 1977
1.094
-0.373
-25.43%
jan 1, 1978
1.121
+0.027
2.47%
jan 1, 1979
1.689
+0.569
50.74%
jan 1, 1980
1.831
+0.141
8.38%
jan 1, 1981
1.773
-0.058
-3.17%
jan 1, 1982
1.538
-0.234
-13.23%
jan 1, 1983
1.442
-0.096
-6.24%
jan 1, 1984
1.819
+0.377
26.13%
jan 1, 1985
2.014
+0.195
10.72%
jan 1, 1986
1.979
-0.035
-1.73%
jan 1, 1987
1.612
-0.367
-18.56%
jan 1, 1988
1.349
-0.263
-16.31%
jan 1, 1989
1.448
+0.099
7.33%
jan 1, 1990
1.526
+0.078
5.36%
jan 1, 1991
1.754
+0.228
14.94%
jan 1, 1992
2.075
+0.322
18.33%
jan 1, 1993
2.172
+0.097
4.68%
jan 1, 1994
3.346
+1.174
54.04%
jan 1, 1995
3.751
+0.405
12.11%
jan 1, 1996
3.379
-0.372
-9.92%
jan 1, 1997
4.133
+0.754
22.3%
jan 1, 1998
3.85
-0.283
-6.86%
jan 1, 1999
2.894
-0.955
-24.82%
jan 1, 2000
2.85
-0.044
-1.52%
jan 1, 2001
3.661
+0.811
28.45%
jan 1, 2002
4.099
+0.438
11.96%
jan 1, 2003
3.482
-0.617
-15.06%
jan 1, 2004
3.276
-0.205
-5.9%
jan 1, 2005
3.224
-0.052
-1.6%
jan 1, 2006
3.048
-0.176
-5.45%
jan 1, 2007
3.117
+0.069
2.26%
jan 1, 2008
3.075
-0.042
-1.34%
jan 1, 2009
3.391
+0.316
10.28%
jan 1, 2010
4.486
+1.095
32.29%
jan 1, 2011
4.162
-0.324
-7.22%
jan 1, 2012
4.626
+0.464
11.14%
jan 1, 2013
4.293
-0.333
-7.21%
jan 1, 2014
4.571
+0.278
6.48%
jan 1, 2015
4.416
-0.155
-3.39%
Ranking of countries by current statistics by years


Comments: