29
/
en
AIzaSyAYiBZKx7MnpbEhh9jyipgxe19OcubqV5w
April 1, 2024
26717
Early-demographic dividend
EAR
false
2
1
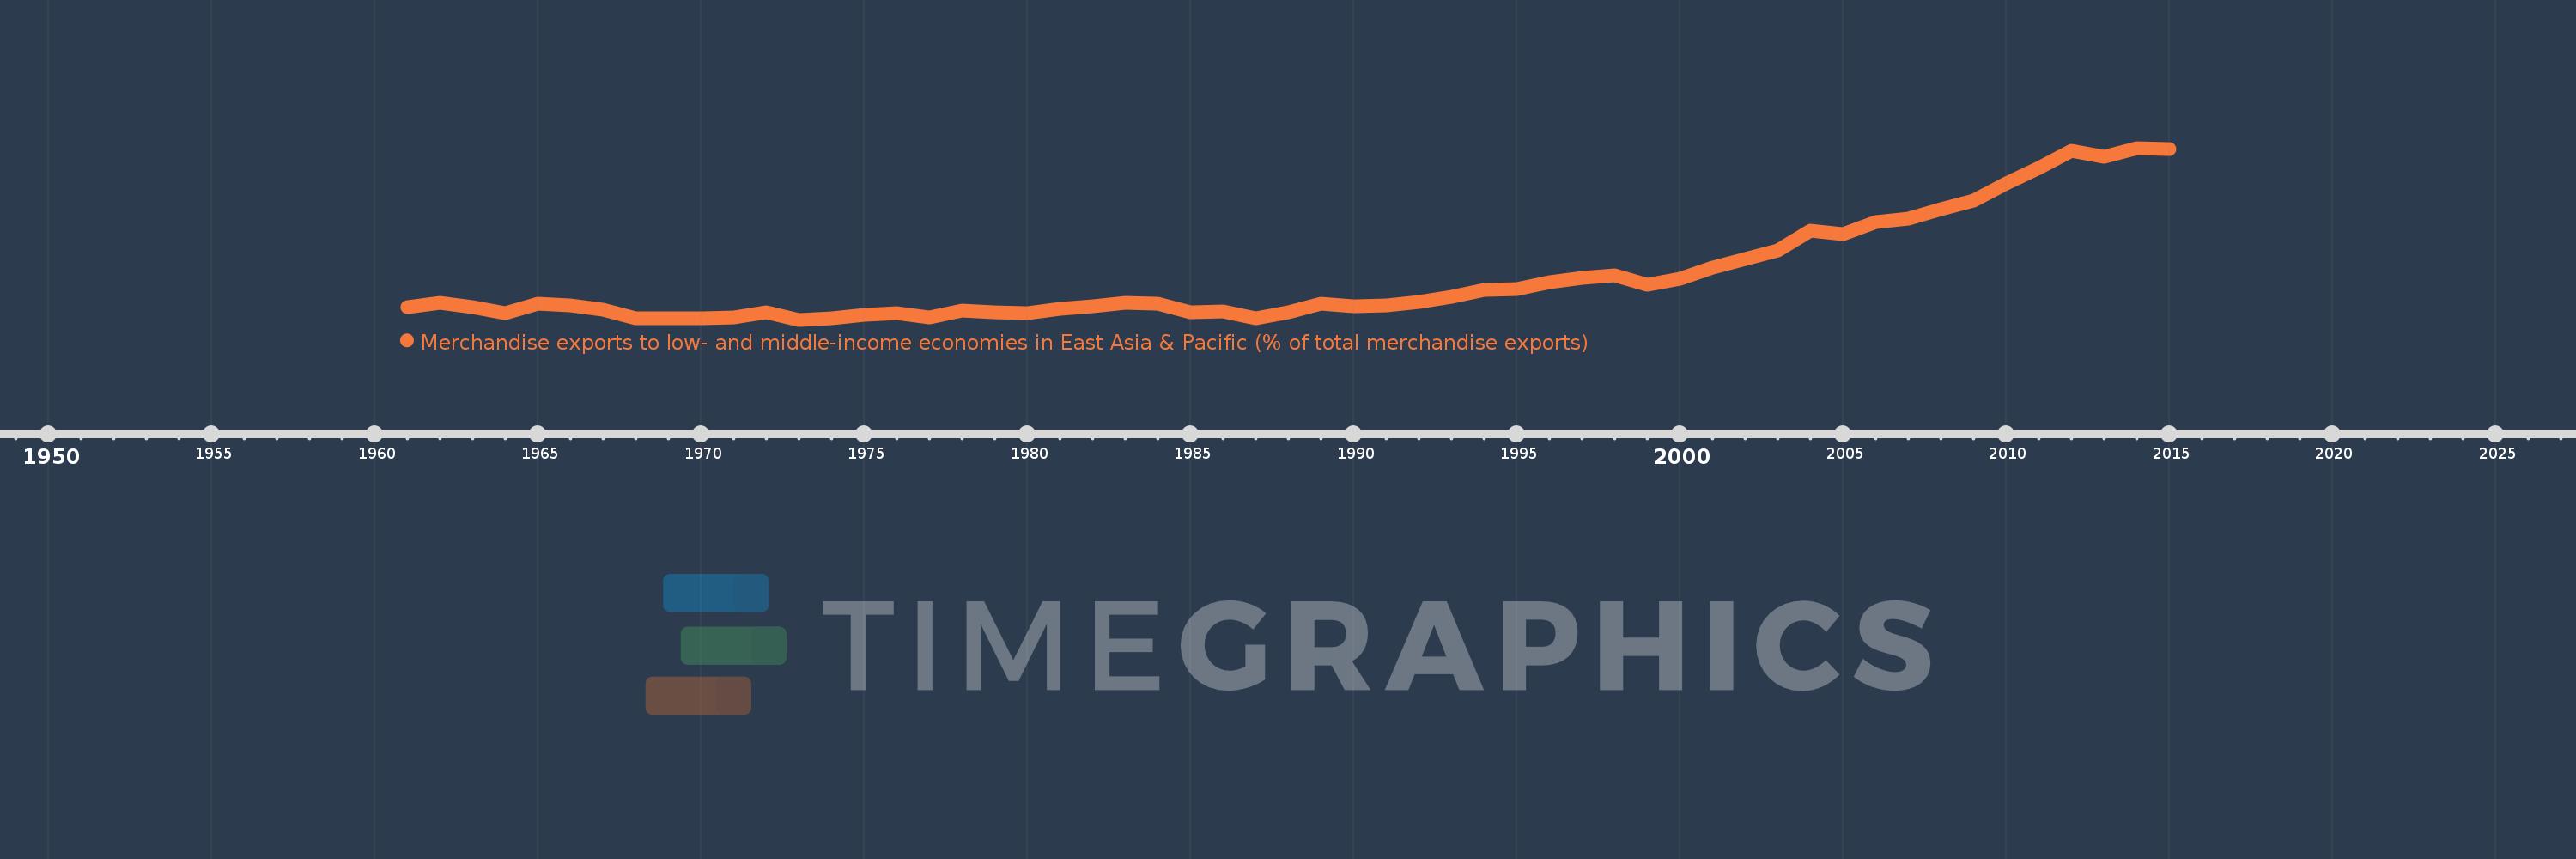
Merchandise exports to low- and middle-income economies in East Asia & Pacific (% of total merchandise exports)
2015,2014,2013,2012,2011,2010,2009,2008,2007,2006,2005,2004,2003,2002,2001,2000,1999,1998,1997,1996,1995,1994,1993,1992,1991,1990,1989,1988,1987,1986,1985,1984,1983,1982,1981,1980,1979,1978,1977,1976,1975,1974,1973,1972,1971,1970,1969,1968,1967,1966,1965,1964,1963,1962,1961
This statistics in other country:
AfghanistanAlbaniaAlgeriaArab WorldArgentinaAustraliaAustriaAzerbaijanBahamas, TheBahrainBangladeshBarbadosBelarusBelgiumBermudaBrazilBrunei DarussalamBulgariaCabo VerdeCambodiaCameroonCanadaCaribbean small statesCentral Europe and the BalticsChileChinaColombiaCosta RicaCote d'IvoireCroatiaCubaCyprusCzech RepublicDenmarkDominicaDominican RepublicEarly-demographic dividendEast Asia & PacificEast Asia & Pacific (excluding high income)East Asia & Pacific (IDA & IBRD countries)EcuadorEgypt, Arab Rep.El SalvadorEstoniaEthiopiaEuro areaEurope & Central AsiaEurope & Central Asia (excluding high income)Europe & Central Asia (IDA & IBRD countries)European UnionFijiFinlandFragile and conflict affected situationsFranceGermanyGhanaGreeceGuatemalaGuyanaHeavily indebted poor countries (HIPC)High incomeHondurasHong Kong SAR, ChinaHungaryIBRD onlyIcelandIDA & IBRD totalIDA blendIDA onlyIDA totalIndiaIndonesiaIran, Islamic Rep.IraqIrelandIsraelItalyJamaicaJapanJordanKazakhstanKenyaKorea, Dem. People’s Rep.Korea, Rep.KuwaitLate-demographic dividendLatin America & Caribbean Latin America & Caribbean (excluding high income)Latin America & the Caribbean (IDA & IBRD countries)LatviaLeast developed countries: UN classificationLebanonLithuaniaLow & middle incomeLow incomeLower middle incomeLuxembourgMacao SAR, ChinaMacedonia, FYRMadagascarMalaysiaMaltaMauritiusMexicoMiddle East & North AfricaMiddle East & North Africa (excluding high income)Middle East & North Africa (IDA & IBRD countries)Middle incomeMoldovaMontenegroMoroccoMozambiqueMyanmarNetherlandsNew CaledoniaNew ZealandNigeriaNorth AmericaNorwayOECD membersOmanOther small statesPacific island small statesPakistanPapua New GuineaParaguayPeruPhilippinesPolandPortugalPost-demographic dividendPre-demographic dividendQatarRomaniaRussian FederationSaudi ArabiaSenegalSerbiaSingaporeSlovak RepublicSloveniaSmall statesSolomon IslandsSomaliaSouth AfricaSouth AsiaSouth Asia (IDA & IBRD)SpainSri LankaSt. LuciaSub-Saharan Africa Sub-Saharan Africa (excluding high income)Sub-Saharan Africa (IDA & IBRD countries)SurinameSwedenSwitzerlandSyrian Arab RepublicTanzaniaThailandTogoTongaTrinidad and TobagoTunisiaTurkeyUgandaUkraineUnited Arab EmiratesUnited KingdomUnited StatesUpper middle incomeVenezuela, RBVietnamWorldYemen, Rep.ZambiaZimbabwe Timeline:
This timeline shows a graph from 1961 to 2015 of Early-demographic dividend. No data until 1960. Number of actual observations by date: 55.
Source name:
World Development Indicators
Source organization:
World Bank staff estimates based data from International Monetary Fund's Direction of Trade database.
Categories, topics:
Private Sector, Trade
Last updated:
apr 23, 2017
Indicators value changes by year
At the date of observation
Value
Absolute change
Change from previous value
jan 1, 1961
2.015
+2.015
0.0%
jan 1, 1962
2.298
+0.283
14.02%
jan 1, 1963
2.02
-0.277
-12.08%
jan 1, 1964
1.654
-0.366
-18.13%
jan 1, 1965
2.256
+0.602
36.38%
jan 1, 1966
2.152
-0.104
-4.61%
jan 1, 1967
1.862
-0.29
-13.47%
jan 1, 1968
1.299
-0.563
-30.22%
jan 1, 1969
1.304
+0.004
0.34%
jan 1, 1970
1.304
+0.0
0.01%
jan 1, 1971
1.358
+0.055
4.2%
jan 1, 1972
1.69
+0.332
24.44%
jan 1, 1973
1.221
-0.469
-27.77%
jan 1, 1974
1.327
+0.106
8.67%
jan 1, 1975
1.523
+0.196
14.79%
jan 1, 1976
1.627
+0.104
6.82%
jan 1, 1977
1.382
-0.246
-15.09%
jan 1, 1978
1.789
+0.407
29.48%
jan 1, 1979
1.691
-0.098
-5.49%
jan 1, 1980
1.637
-0.054
-3.2%
jan 1, 1981
1.919
+0.282
17.26%
jan 1, 1982
2.097
+0.178
9.27%
jan 1, 1983
2.278
+0.182
8.66%
jan 1, 1984
2.252
-0.027
-1.17%
jan 1, 1985
1.68
-0.572
-25.39%
jan 1, 1986
1.766
+0.086
5.12%
jan 1, 1987
1.328
-0.438
-24.79%
jan 1, 1988
1.676
+0.348
26.18%
jan 1, 1989
2.266
+0.59
35.23%
jan 1, 1990
2.096
-0.17
-7.52%
jan 1, 1991
2.117
+0.021
1.02%
jan 1, 1992
2.372
+0.255
12.04%
jan 1, 1993
2.653
+0.28
11.81%
jan 1, 1994
3.095
+0.443
16.69%
jan 1, 1995
3.164
+0.069
2.23%
jan 1, 1996
3.603
+0.438
13.86%
jan 1, 1997
3.864
+0.262
7.27%
jan 1, 1998
4.047
+0.182
4.71%
jan 1, 1999
3.418
-0.628
-15.52%
jan 1, 2000
3.839
+0.42
12.29%
jan 1, 2001
4.547
+0.708
18.45%
jan 1, 2002
5.092
+0.545
11.98%
jan 1, 2003
5.599
+0.507
9.96%
jan 1, 2004
6.87
+1.271
22.69%
jan 1, 2005
6.68
-0.189
-2.75%
jan 1, 2006
7.411
+0.73
10.93%
jan 1, 2007
7.655
+0.244
3.3%
jan 1, 2008
8.241
+0.586
7.66%
jan 1, 2009
8.812
+0.57
6.92%
jan 1, 2010
9.895
+1.083
12.29%
jan 1, 2011
10.871
+0.976
9.86%
jan 1, 2012
11.932
+1.061
9.76%
jan 1, 2013
11.583
-0.35
-2.93%
jan 1, 2014
12.13
+0.547
4.73%
jan 1, 2015
12.044
-0.085
-0.7%
Ranking of countries by current statistics by years


Comments: