29
/
en
AIzaSyAYiBZKx7MnpbEhh9jyipgxe19OcubqV5w
April 1, 2024
56392
Small states
SST
false
2
1
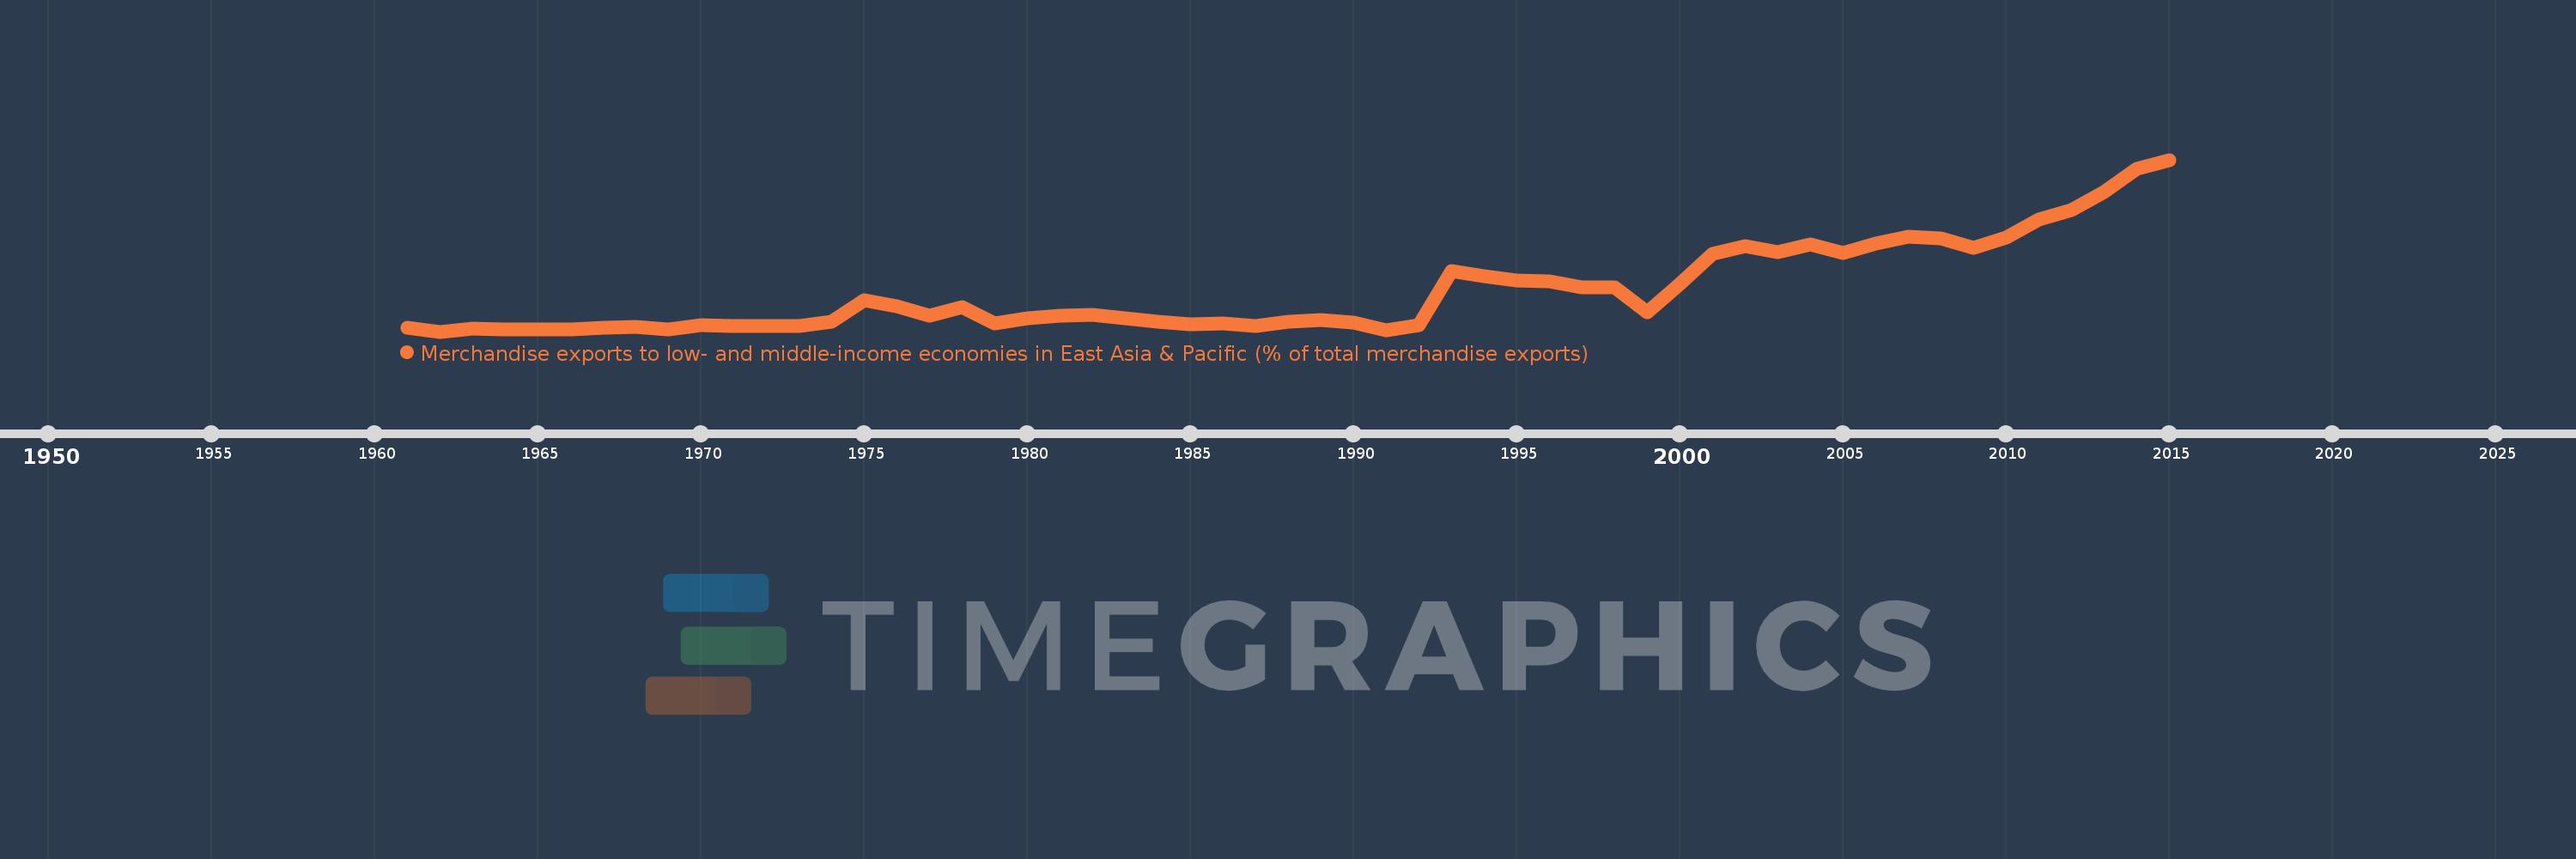
Merchandise exports to low- and middle-income economies in East Asia & Pacific (% of total merchandise exports)
2015,2014,2013,2012,2011,2010,2009,2008,2007,2006,2005,2004,2003,2002,2001,2000,1999,1998,1997,1996,1995,1994,1993,1992,1991,1990,1989,1988,1987,1986,1985,1984,1983,1982,1981,1980,1979,1978,1977,1976,1975,1974,1973,1972,1971,1970,1969,1968,1967,1966,1965,1964,1963,1962,1961
This statistics in other country:
AfghanistanAlbaniaAlgeriaArab WorldArgentinaAustraliaAustriaAzerbaijanBahamas, TheBahrainBangladeshBarbadosBelarusBelgiumBermudaBrazilBrunei DarussalamBulgariaCabo VerdeCambodiaCameroonCanadaCaribbean small statesCentral Europe and the BalticsChileChinaColombiaCosta RicaCote d'IvoireCroatiaCubaCyprusCzech RepublicDenmarkDominicaDominican RepublicEarly-demographic dividendEast Asia & PacificEast Asia & Pacific (excluding high income)East Asia & Pacific (IDA & IBRD countries)EcuadorEgypt, Arab Rep.El SalvadorEstoniaEthiopiaEuro areaEurope & Central AsiaEurope & Central Asia (excluding high income)Europe & Central Asia (IDA & IBRD countries)European UnionFijiFinlandFragile and conflict affected situationsFranceGermanyGhanaGreeceGuatemalaGuyanaHeavily indebted poor countries (HIPC)High incomeHondurasHong Kong SAR, ChinaHungaryIBRD onlyIcelandIDA & IBRD totalIDA blendIDA onlyIDA totalIndiaIndonesiaIran, Islamic Rep.IraqIrelandIsraelItalyJamaicaJapanJordanKazakhstanKenyaKorea, Dem. People’s Rep.Korea, Rep.KuwaitLate-demographic dividendLatin America & Caribbean Latin America & Caribbean (excluding high income)Latin America & the Caribbean (IDA & IBRD countries)LatviaLeast developed countries: UN classificationLebanonLithuaniaLow & middle incomeLow incomeLower middle incomeLuxembourgMacao SAR, ChinaMacedonia, FYRMadagascarMalaysiaMaltaMauritiusMexicoMiddle East & North AfricaMiddle East & North Africa (excluding high income)Middle East & North Africa (IDA & IBRD countries)Middle incomeMoldovaMontenegroMoroccoMozambiqueMyanmarNetherlandsNew CaledoniaNew ZealandNigeriaNorth AmericaNorwayOECD membersOmanOther small statesPacific island small statesPakistanPapua New GuineaParaguayPeruPhilippinesPolandPortugalPost-demographic dividendPre-demographic dividendQatarRomaniaRussian FederationSaudi ArabiaSenegalSerbiaSingaporeSlovak RepublicSloveniaSmall statesSolomon IslandsSomaliaSouth AfricaSouth AsiaSouth Asia (IDA & IBRD)SpainSri LankaSt. LuciaSub-Saharan Africa Sub-Saharan Africa (excluding high income)Sub-Saharan Africa (IDA & IBRD countries)SurinameSwedenSwitzerlandSyrian Arab RepublicTanzaniaThailandTogoTongaTrinidad and TobagoTunisiaTurkeyUgandaUkraineUnited Arab EmiratesUnited KingdomUnited StatesUpper middle incomeVenezuela, RBVietnamWorldYemen, Rep.ZambiaZimbabwe Timeline:
This timeline shows a graph from 1961 to 2015 of Small states. No data until 1960. Number of actual observations by date: 55.
Source name:
World Development Indicators
Source organization:
World Bank staff estimates based data from International Monetary Fund's Direction of Trade database.
Categories, topics:
Private Sector, Trade
Last updated:
apr 23, 2017
Indicators value changes by year
At the date of observation
Value
Absolute change
Change from previous value
jan 1, 1961
0.207
+0.207
0.0%
jan 1, 1962
0.011
-0.196
-94.74%
jan 1, 1963
0.16
+0.149
1.37K%
jan 1, 1964
0.121
-0.039
-24.49%
jan 1, 1965
0.114
-0.007
-5.8%
jan 1, 1966
0.099
-0.015
-13.06%
jan 1, 1967
0.209
+0.11
111.52%
jan 1, 1968
0.215
+0.005
2.53%
jan 1, 1969
0.121
-0.094
-43.84%
jan 1, 1970
0.323
+0.203
168.03%
jan 1, 1971
0.273
-0.05
-15.34%
jan 1, 1972
0.287
+0.014
4.99%
jan 1, 1973
0.27
-0.017
-5.91%
jan 1, 1974
0.466
+0.196
72.48%
jan 1, 1975
1.477
+1.011
217.01%
jan 1, 1976
1.217
-0.26
-17.63%
jan 1, 1977
0.754
-0.463
-38.03%
jan 1, 1978
1.158
+0.404
53.52%
jan 1, 1979
0.404
-0.754
-65.1%
jan 1, 1980
0.647
+0.243
60.22%
jan 1, 1981
0.75
+0.103
15.88%
jan 1, 1982
0.798
+0.048
6.44%
jan 1, 1983
0.629
-0.17
-21.24%
jan 1, 1984
0.494
-0.135
-21.48%
jan 1, 1985
0.357
-0.137
-27.69%
jan 1, 1986
0.404
+0.047
13.04%
jan 1, 1987
0.257
-0.146
-36.24%
jan 1, 1988
0.481
+0.223
86.83%
jan 1, 1989
0.548
+0.067
13.9%
jan 1, 1990
0.438
-0.11
-20.06%
jan 1, 1991
0.081
-0.356
-81.44%
jan 1, 1992
0.315
+0.233
287.36%
jan 1, 1993
2.839
+2.524
802.22%
jan 1, 1994
2.624
-0.215
-7.57%
jan 1, 1995
2.406
-0.218
-8.31%
jan 1, 1996
2.38
-0.026
-1.1%
jan 1, 1997
2.071
-0.309
-12.98%
jan 1, 1998
2.081
+0.01
0.48%
jan 1, 1999
0.911
-1.169
-56.19%
jan 1, 2000
2.259
+1.348
147.87%
jan 1, 2001
3.659
+1.4
61.97%
jan 1, 2002
4.021
+0.362
9.89%
jan 1, 2003
3.753
-0.268
-6.68%
jan 1, 2004
4.116
+0.363
9.68%
jan 1, 2005
3.696
-0.42
-10.21%
jan 1, 2006
4.157
+0.461
12.48%
jan 1, 2007
4.462
+0.305
7.34%
jan 1, 2008
4.396
-0.066
-1.49%
jan 1, 2009
3.954
-0.441
-10.04%
jan 1, 2010
4.43
+0.476
12.03%
jan 1, 2011
5.269
+0.839
18.95%
jan 1, 2012
5.721
+0.452
8.58%
jan 1, 2013
6.556
+0.834
14.58%
jan 1, 2014
7.648
+1.092
16.66%
jan 1, 2015
8.075
+0.427
5.59%
Ranking of countries by current statistics by years


Comments: