29
/
en
AIzaSyAYiBZKx7MnpbEhh9jyipgxe19OcubqV5w
April 1, 2024
48307
Middle East & North Africa
MEA
false
2
1
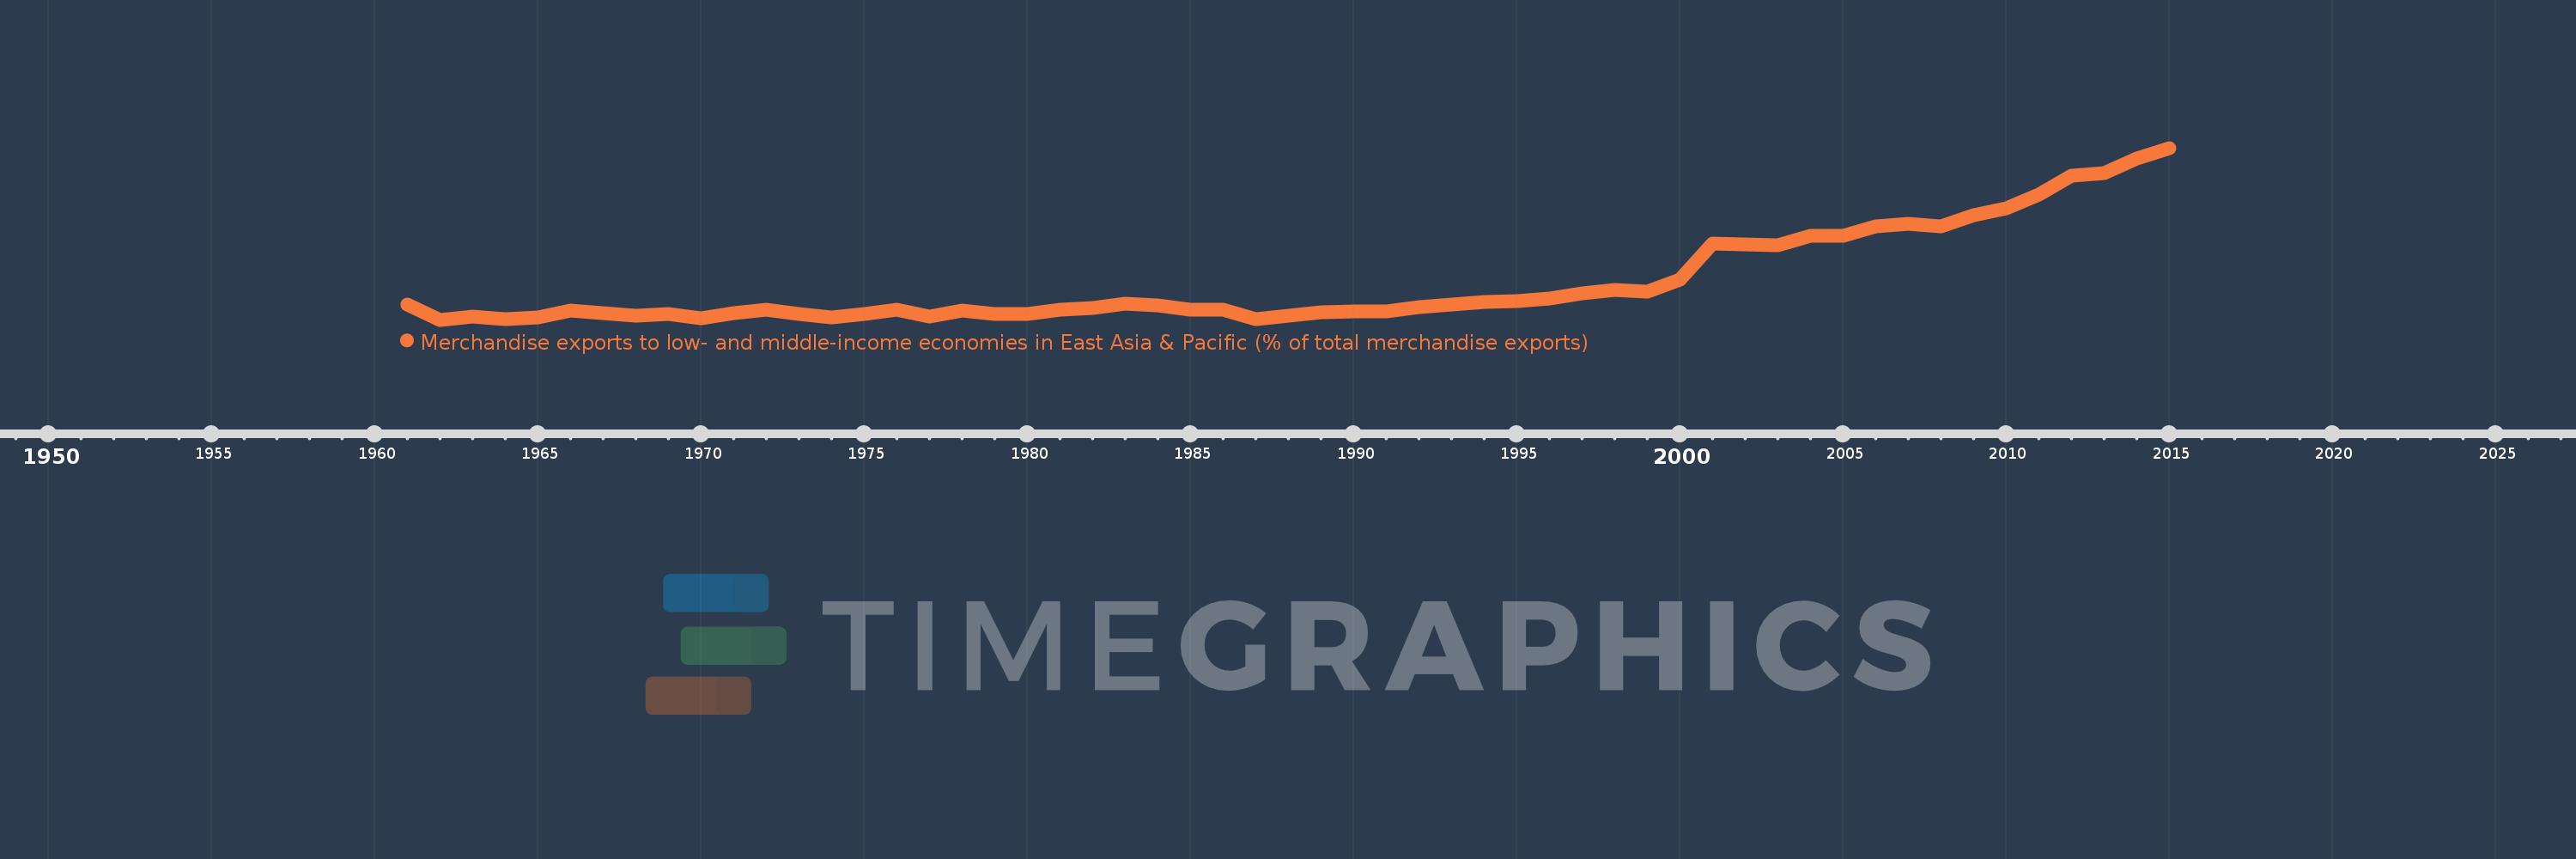
Merchandise exports to low- and middle-income economies in East Asia & Pacific (% of total merchandise exports)
2015,2014,2013,2012,2011,2010,2009,2008,2007,2006,2005,2004,2003,2002,2001,2000,1999,1998,1997,1996,1995,1994,1993,1992,1991,1990,1989,1988,1987,1986,1985,1984,1983,1982,1981,1980,1979,1978,1977,1976,1975,1974,1973,1972,1971,1970,1969,1968,1967,1966,1965,1964,1963,1962,1961
This statistics in other country:
AfghanistanAlbaniaAlgeriaArab WorldArgentinaAustraliaAustriaAzerbaijanBahamas, TheBahrainBangladeshBarbadosBelarusBelgiumBermudaBrazilBrunei DarussalamBulgariaCabo VerdeCambodiaCameroonCanadaCaribbean small statesCentral Europe and the BalticsChileChinaColombiaCosta RicaCote d'IvoireCroatiaCubaCyprusCzech RepublicDenmarkDominicaDominican RepublicEarly-demographic dividendEast Asia & PacificEast Asia & Pacific (excluding high income)East Asia & Pacific (IDA & IBRD countries)EcuadorEgypt, Arab Rep.El SalvadorEstoniaEthiopiaEuro areaEurope & Central AsiaEurope & Central Asia (excluding high income)Europe & Central Asia (IDA & IBRD countries)European UnionFijiFinlandFragile and conflict affected situationsFranceGermanyGhanaGreeceGuatemalaGuyanaHeavily indebted poor countries (HIPC)High incomeHondurasHong Kong SAR, ChinaHungaryIBRD onlyIcelandIDA & IBRD totalIDA blendIDA onlyIDA totalIndiaIndonesiaIran, Islamic Rep.IraqIrelandIsraelItalyJamaicaJapanJordanKazakhstanKenyaKorea, Dem. People’s Rep.Korea, Rep.KuwaitLate-demographic dividendLatin America & Caribbean Latin America & Caribbean (excluding high income)Latin America & the Caribbean (IDA & IBRD countries)LatviaLeast developed countries: UN classificationLebanonLithuaniaLow & middle incomeLow incomeLower middle incomeLuxembourgMacao SAR, ChinaMacedonia, FYRMadagascarMalaysiaMaltaMauritiusMexicoMiddle East & North AfricaMiddle East & North Africa (excluding high income)Middle East & North Africa (IDA & IBRD countries)Middle incomeMoldovaMontenegroMoroccoMozambiqueMyanmarNetherlandsNew CaledoniaNew ZealandNigeriaNorth AmericaNorwayOECD membersOmanOther small statesPacific island small statesPakistanPapua New GuineaParaguayPeruPhilippinesPolandPortugalPost-demographic dividendPre-demographic dividendQatarRomaniaRussian FederationSaudi ArabiaSenegalSerbiaSingaporeSlovak RepublicSloveniaSmall statesSolomon IslandsSomaliaSouth AfricaSouth AsiaSouth Asia (IDA & IBRD)SpainSri LankaSt. LuciaSub-Saharan Africa Sub-Saharan Africa (excluding high income)Sub-Saharan Africa (IDA & IBRD countries)SurinameSwedenSwitzerlandSyrian Arab RepublicTanzaniaThailandTogoTongaTrinidad and TobagoTunisiaTurkeyUgandaUkraineUnited Arab EmiratesUnited KingdomUnited StatesUpper middle incomeVenezuela, RBVietnamWorldYemen, Rep.ZambiaZimbabwe Timeline:
This timeline shows a graph from 1961 to 2015 of Middle East & North Africa. No data until 1960. Number of actual observations by date: 55.
Source name:
World Development Indicators
Source organization:
World Bank staff estimates based data from International Monetary Fund's Direction of Trade database.
Categories, topics:
Private Sector, Trade
Last updated:
apr 23, 2017
Indicators value changes by year
Maximum:
16.231
jan 1, 2015
At the date of observation
Value
Absolute change
Change from previous value
jan 1, 1961
2.274
+2.274
0.0%
jan 1, 1962
0.886
-1.388
-61.04%
jan 1, 1963
1.185
+0.299
33.76%
jan 1, 1964
0.907
-0.278
-23.47%
jan 1, 1965
1.106
+0.199
21.97%
jan 1, 1966
1.683
+0.577
52.15%
jan 1, 1967
1.464
-0.219
-13.02%
jan 1, 1968
1.237
-0.227
-15.51%
jan 1, 1969
1.394
+0.157
12.68%
jan 1, 1970
1.035
-0.358
-25.71%
jan 1, 1971
1.479
+0.444
42.85%
jan 1, 1972
1.754
+0.275
18.59%
jan 1, 1973
1.438
-0.316
-18.03%
jan 1, 1974
1.115
-0.323
-22.43%
jan 1, 1975
1.435
+0.32
28.69%
jan 1, 1976
1.776
+0.34
23.71%
jan 1, 1977
1.16
-0.616
-34.67%
jan 1, 1978
1.702
+0.542
46.7%
jan 1, 1979
1.366
-0.335
-19.71%
jan 1, 1980
1.392
+0.025
1.87%
jan 1, 1981
1.752
+0.36
25.88%
jan 1, 1982
1.913
+0.161
9.19%
jan 1, 1983
2.283
+0.37
19.36%
jan 1, 1984
2.129
-0.154
-6.76%
jan 1, 1985
1.77
-0.358
-16.83%
jan 1, 1986
1.785
+0.014
0.8%
jan 1, 1987
0.909
-0.875
-49.04%
jan 1, 1988
1.258
+0.349
38.38%
jan 1, 1989
1.587
+0.329
26.13%
jan 1, 1990
1.668
+0.081
5.08%
jan 1, 1991
1.617
-0.051
-3.04%
jan 1, 1992
1.984
+0.367
22.71%
jan 1, 1993
2.264
+0.279
14.08%
jan 1, 1994
2.477
+0.213
9.41%
jan 1, 1995
2.579
+0.102
4.13%
jan 1, 1996
2.782
+0.203
7.87%
jan 1, 1997
3.209
+0.427
15.33%
jan 1, 1998
3.584
+0.375
11.7%
jan 1, 1999
3.408
-0.176
-4.92%
jan 1, 2000
4.439
+1.031
30.25%
jan 1, 2001
7.689
+3.25
73.21%
jan 1, 2002
7.653
-0.036
-0.47%
jan 1, 2003
7.517
-0.136
-1.78%
jan 1, 2004
8.346
+0.829
11.03%
jan 1, 2005
8.349
+0.003
0.03%
jan 1, 2006
9.223
+0.874
10.47%
jan 1, 2007
9.419
+0.196
2.13%
jan 1, 2008
9.222
-0.197
-2.09%
jan 1, 2009
10.223
+1.001
10.86%
jan 1, 2010
10.857
+0.634
6.2%
jan 1, 2011
12.067
+1.21
11.14%
jan 1, 2012
13.782
+1.716
14.22%
jan 1, 2013
13.985
+0.202
1.47%
jan 1, 2014
15.312
+1.327
9.49%
jan 1, 2015
16.231
+0.919
6.0%
Ranking of countries by current statistics by years


Comments: