29
/
en
AIzaSyAYiBZKx7MnpbEhh9jyipgxe19OcubqV5w
April 1, 2024
117143
Cyprus
CYP
true
2
1
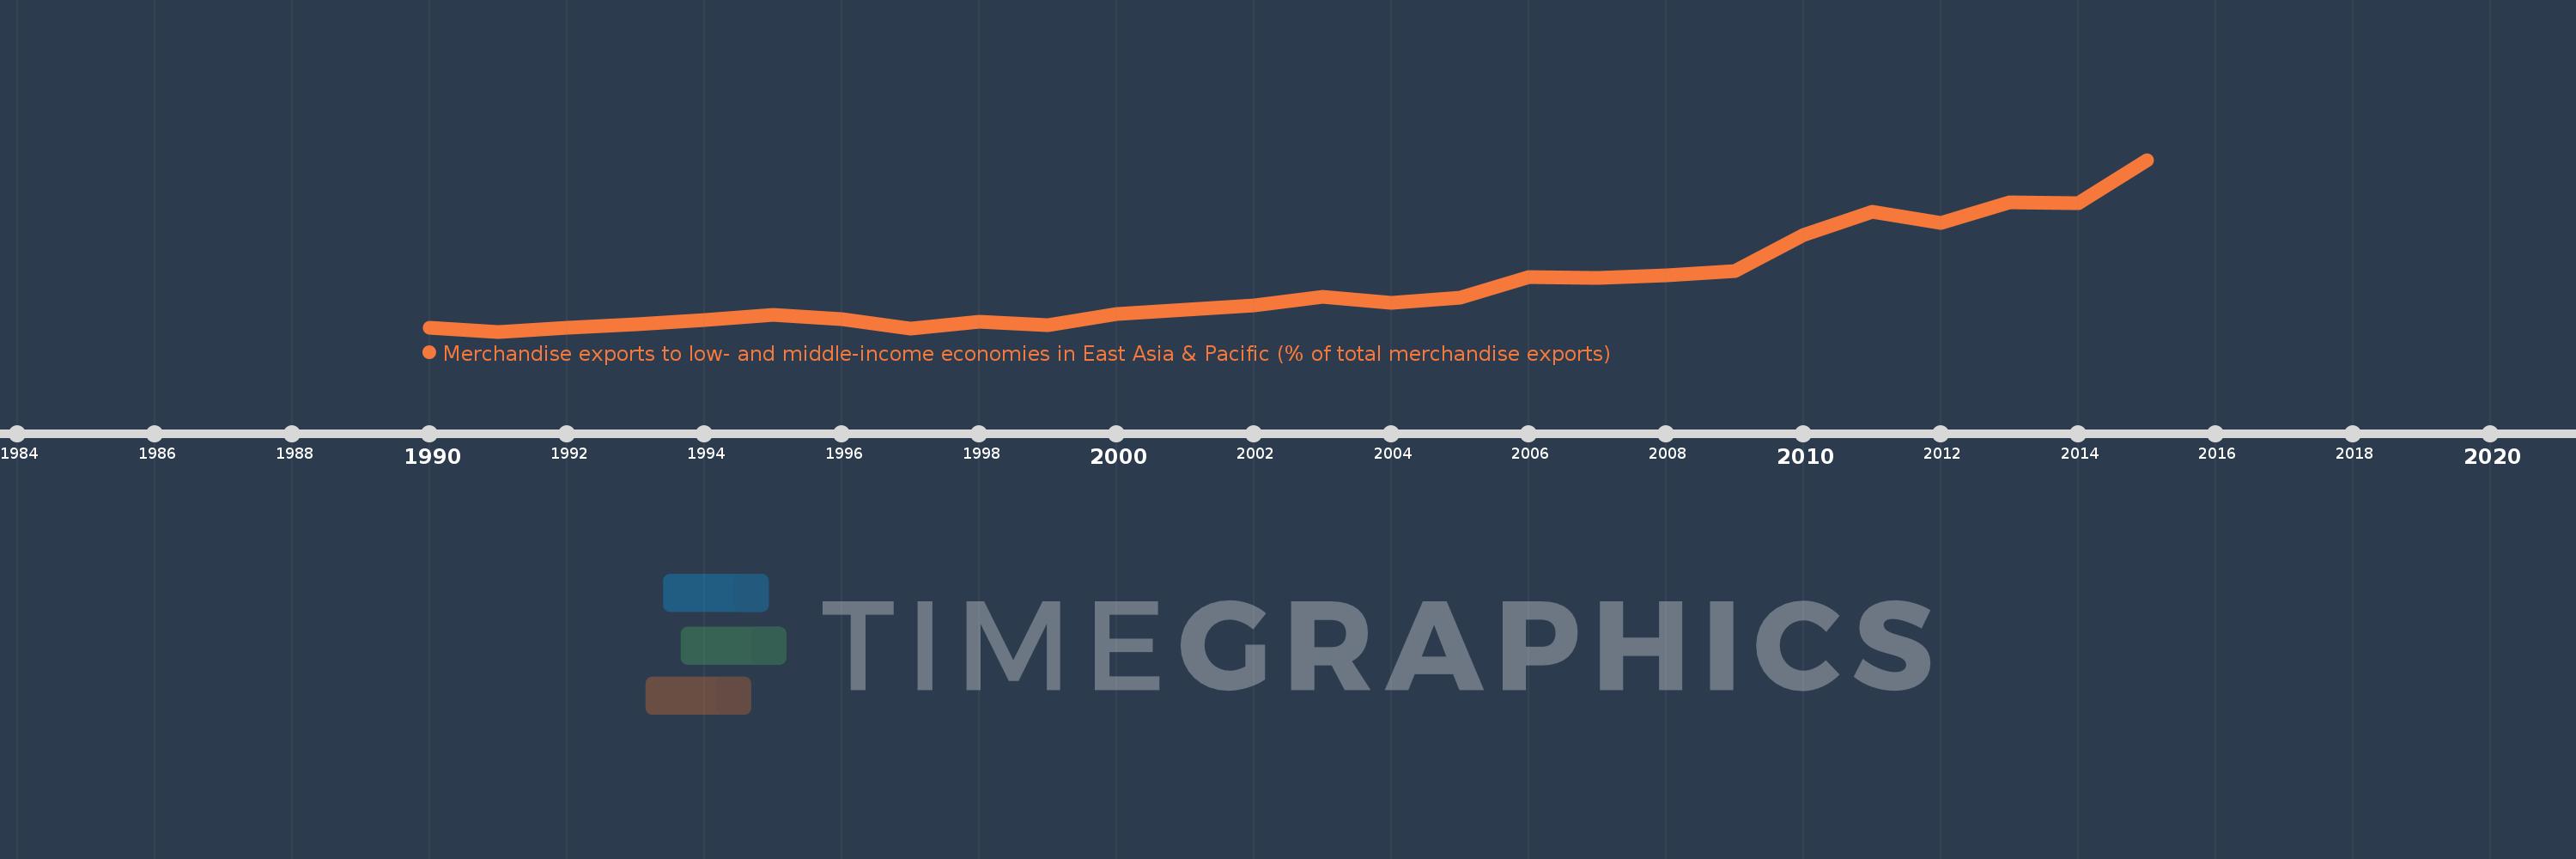
Merchandise exports to low- and middle-income economies in East Asia & Pacific (% of total merchandise exports)
2015,2014,2013,2012,2011,2010,2009,2008,2007,2006,2005,2004,2003,2002,2001,2000,1999,1998,1997,1996,1995,1994,1993,1992,1991,1990
This statistics in other country:
AfghanistanAlbaniaAlgeriaArab WorldArgentinaAustraliaAustriaAzerbaijanBahamas, TheBahrainBangladeshBarbadosBelarusBelgiumBermudaBrazilBrunei DarussalamBulgariaCabo VerdeCambodiaCameroonCanadaCaribbean small statesCentral Europe and the BalticsChileChinaColombiaCosta RicaCote d'IvoireCroatiaCubaCyprusCzech RepublicDenmarkDominicaDominican RepublicEarly-demographic dividendEast Asia & PacificEast Asia & Pacific (excluding high income)East Asia & Pacific (IDA & IBRD countries)EcuadorEgypt, Arab Rep.El SalvadorEstoniaEthiopiaEuro areaEurope & Central AsiaEurope & Central Asia (excluding high income)Europe & Central Asia (IDA & IBRD countries)European UnionFijiFinlandFragile and conflict affected situationsFranceGermanyGhanaGreeceGuatemalaGuyanaHeavily indebted poor countries (HIPC)High incomeHondurasHong Kong SAR, ChinaHungaryIBRD onlyIcelandIDA & IBRD totalIDA blendIDA onlyIDA totalIndiaIndonesiaIran, Islamic Rep.IraqIrelandIsraelItalyJamaicaJapanJordanKazakhstanKenyaKorea, Dem. People’s Rep.Korea, Rep.KuwaitLate-demographic dividendLatin America & Caribbean Latin America & Caribbean (excluding high income)Latin America & the Caribbean (IDA & IBRD countries)LatviaLeast developed countries: UN classificationLebanonLithuaniaLow & middle incomeLow incomeLower middle incomeLuxembourgMacao SAR, ChinaMacedonia, FYRMadagascarMalaysiaMaltaMauritiusMexicoMiddle East & North AfricaMiddle East & North Africa (excluding high income)Middle East & North Africa (IDA & IBRD countries)Middle incomeMoldovaMontenegroMoroccoMozambiqueMyanmarNetherlandsNew CaledoniaNew ZealandNigeriaNorth AmericaNorwayOECD membersOmanOther small statesPacific island small statesPakistanPapua New GuineaParaguayPeruPhilippinesPolandPortugalPost-demographic dividendPre-demographic dividendQatarRomaniaRussian FederationSaudi ArabiaSenegalSerbiaSingaporeSlovak RepublicSloveniaSmall statesSolomon IslandsSomaliaSouth AfricaSouth AsiaSouth Asia (IDA & IBRD)SpainSri LankaSt. LuciaSub-Saharan Africa Sub-Saharan Africa (excluding high income)Sub-Saharan Africa (IDA & IBRD countries)SurinameSwedenSwitzerlandSyrian Arab RepublicTanzaniaThailandTogoTongaTrinidad and TobagoTunisiaTurkeyUgandaUkraineUnited Arab EmiratesUnited KingdomUnited StatesUpper middle incomeVenezuela, RBVietnamWorldYemen, Rep.ZambiaZimbabwe Timeline:
This timeline shows a graph from 1990 to 2015 of Cyprus. No data until 1989. Number of actual observations by date: 26.
Source name:
World Development Indicators
Source organization:
World Bank staff estimates based data from International Monetary Fund's Direction of Trade database.
Categories, topics:
Private Sector, Trade
Last updated:
apr 23, 2017
Indicators value changes by year
At the date of observation
Value
Absolute change
Change from previous value
jan 1, 1990
0.392
+0.392
0.0%
jan 1, 1991
0.293
-0.099
-25.29%
jan 1, 1992
0.401
+0.108
36.88%
jan 1, 1993
0.482
+0.081
20.16%
jan 1, 1994
0.613
+0.131
27.2%
jan 1, 1995
0.743
+0.13
21.22%
jan 1, 1996
0.638
-0.105
-14.18%
jan 1, 1997
0.378
-0.26
-40.73%
jan 1, 1998
0.564
+0.186
49.07%
jan 1, 1999
0.477
-0.087
-15.46%
jan 1, 2000
0.78
+0.303
63.68%
jan 1, 2001
0.883
+0.103
13.25%
jan 1, 2002
1.004
+0.121
13.69%
jan 1, 2003
1.233
+0.229
22.81%
jan 1, 2004
1.086
-0.147
-11.95%
jan 1, 2005
1.216
+0.13
12.0%
jan 1, 2006
1.786
+0.569
46.81%
jan 1, 2007
1.745
-0.041
-2.27%
jan 1, 2008
1.812
+0.067
3.85%
jan 1, 2009
1.932
+0.12
6.61%
jan 1, 2010
2.919
+0.987
51.08%
jan 1, 2011
3.549
+0.63
21.58%
jan 1, 2012
3.246
-0.303
-8.54%
jan 1, 2013
3.811
+0.565
17.41%
jan 1, 2014
3.784
-0.028
-0.73%
jan 1, 2015
4.962
+1.178
31.15%
Ranking of countries by current statistics by years


Comments: