29
/
en
AIzaSyAYiBZKx7MnpbEhh9jyipgxe19OcubqV5w
April 1, 2024
78519
Bangladesh
BGD
true
2
1
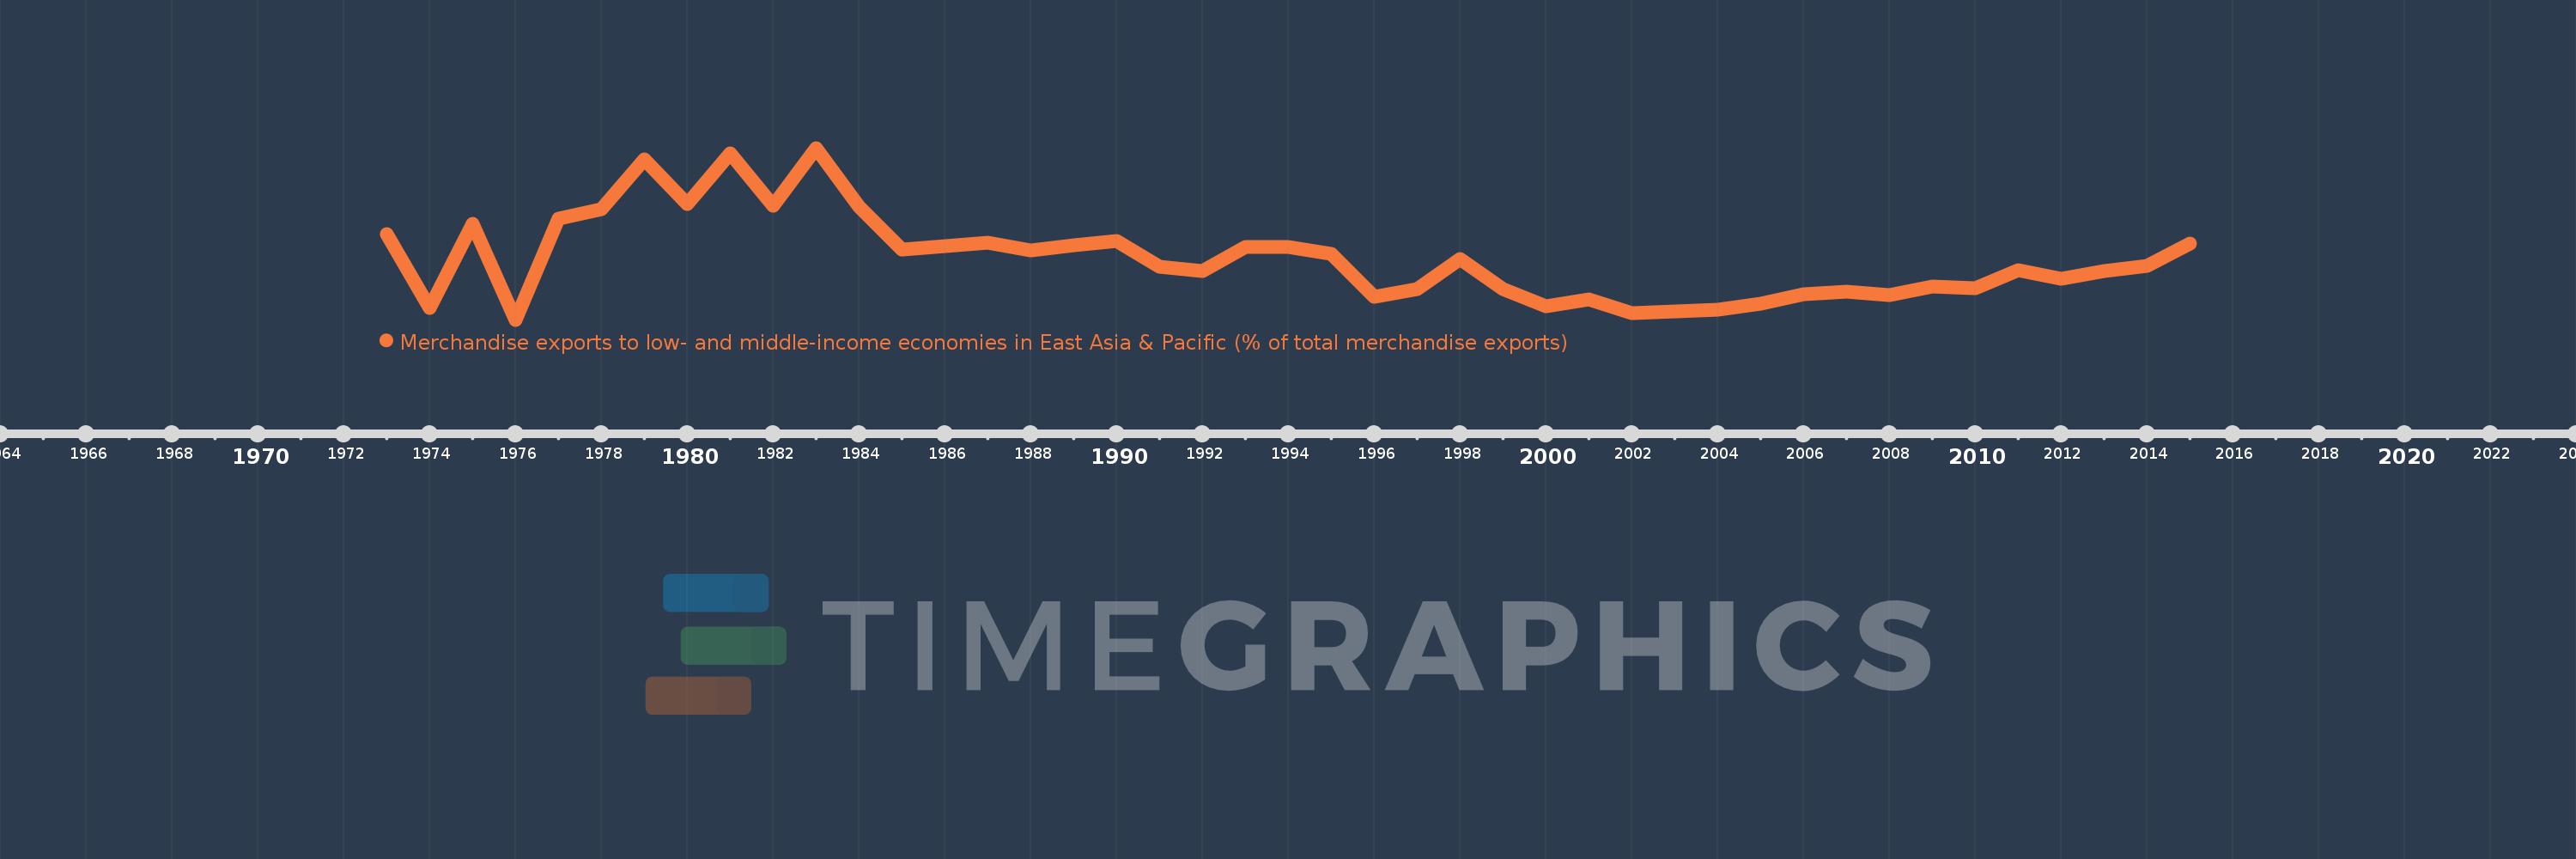
Merchandise exports to low- and middle-income economies in East Asia & Pacific (% of total merchandise exports)
2015,2014,2013,2012,2011,2010,2009,2008,2007,2006,2005,2004,2003,2002,2001,2000,1999,1998,1997,1996,1995,1994,1993,1992,1991,1990,1989,1988,1987,1986,1985,1984,1983,1982,1981,1980,1979,1978,1977,1976,1975,1974,1973
This statistics in other country:
AfghanistanAlbaniaAlgeriaArab WorldArgentinaAustraliaAustriaAzerbaijanBahamas, TheBahrainBangladeshBarbadosBelarusBelgiumBermudaBrazilBrunei DarussalamBulgariaCabo VerdeCambodiaCameroonCanadaCaribbean small statesCentral Europe and the BalticsChileChinaColombiaCosta RicaCote d'IvoireCroatiaCubaCyprusCzech RepublicDenmarkDominicaDominican RepublicEarly-demographic dividendEast Asia & PacificEast Asia & Pacific (excluding high income)East Asia & Pacific (IDA & IBRD countries)EcuadorEgypt, Arab Rep.El SalvadorEstoniaEthiopiaEuro areaEurope & Central AsiaEurope & Central Asia (excluding high income)Europe & Central Asia (IDA & IBRD countries)European UnionFijiFinlandFragile and conflict affected situationsFranceGermanyGhanaGreeceGuatemalaGuyanaHeavily indebted poor countries (HIPC)High incomeHondurasHong Kong SAR, ChinaHungaryIBRD onlyIcelandIDA & IBRD totalIDA blendIDA onlyIDA totalIndiaIndonesiaIran, Islamic Rep.IraqIrelandIsraelItalyJamaicaJapanJordanKazakhstanKenyaKorea, Dem. People’s Rep.Korea, Rep.KuwaitLate-demographic dividendLatin America & Caribbean Latin America & Caribbean (excluding high income)Latin America & the Caribbean (IDA & IBRD countries)LatviaLeast developed countries: UN classificationLebanonLithuaniaLow & middle incomeLow incomeLower middle incomeLuxembourgMacao SAR, ChinaMacedonia, FYRMadagascarMalaysiaMaltaMauritiusMexicoMiddle East & North AfricaMiddle East & North Africa (excluding high income)Middle East & North Africa (IDA & IBRD countries)Middle incomeMoldovaMontenegroMoroccoMozambiqueMyanmarNetherlandsNew CaledoniaNew ZealandNigeriaNorth AmericaNorwayOECD membersOmanOther small statesPacific island small statesPakistanPapua New GuineaParaguayPeruPhilippinesPolandPortugalPost-demographic dividendPre-demographic dividendQatarRomaniaRussian FederationSaudi ArabiaSenegalSerbiaSingaporeSlovak RepublicSloveniaSmall statesSolomon IslandsSomaliaSouth AfricaSouth AsiaSouth Asia (IDA & IBRD)SpainSri LankaSt. LuciaSub-Saharan Africa Sub-Saharan Africa (excluding high income)Sub-Saharan Africa (IDA & IBRD countries)SurinameSwedenSwitzerlandSyrian Arab RepublicTanzaniaThailandTogoTongaTrinidad and TobagoTunisiaTurkeyUgandaUkraineUnited Arab EmiratesUnited KingdomUnited StatesUpper middle incomeVenezuela, RBVietnamWorldYemen, Rep.ZambiaZimbabwe Timeline:
This timeline shows a graph from 1973 to 2015 of Bangladesh. No data until 1972. Number of actual observations by date: 43.
Source name:
World Development Indicators
Source organization:
World Bank staff estimates based data from International Monetary Fund's Direction of Trade database.
Categories, topics:
Private Sector, Trade
Last updated:
apr 23, 2017
Indicators value changes by year
At the date of observation
Value
Absolute change
Change from previous value
jan 1, 1973
3.769
+3.769
0.0%
jan 1, 1974
1.075
-2.693
-71.46%
jan 1, 1975
4.128
+3.053
283.88%
jan 1, 1976
0.639
-3.489
-84.52%
jan 1, 1977
4.315
+3.677
575.4%
jan 1, 1978
4.656
+0.34
7.88%
jan 1, 1979
6.473
+1.817
39.03%
jan 1, 1980
4.855
-1.618
-25.0%
jan 1, 1981
6.699
+1.844
37.98%
jan 1, 1982
4.798
-1.9
-28.37%
jan 1, 1983
6.893
+2.095
43.65%
jan 1, 1984
4.764
-2.129
-30.89%
jan 1, 1985
3.209
-1.555
-32.63%
jan 1, 1986
3.306
+0.097
3.01%
jan 1, 1987
3.457
+0.151
4.58%
jan 1, 1988
3.166
-0.291
-8.42%
jan 1, 1989
3.348
+0.182
5.76%
jan 1, 1990
3.496
+0.148
4.43%
jan 1, 1991
2.56
-0.936
-26.78%
jan 1, 1992
2.402
-0.158
-6.19%
jan 1, 1993
3.297
+0.895
37.25%
jan 1, 1994
3.285
-0.012
-0.36%
jan 1, 1995
3.032
-0.253
-7.7%
jan 1, 1996
1.474
-1.558
-51.38%
jan 1, 1997
1.744
+0.27
18.34%
jan 1, 1998
2.836
+1.091
62.57%
jan 1, 1999
1.765
-1.07
-37.75%
jan 1, 2000
1.119
-0.646
-36.62%
jan 1, 2001
1.384
+0.265
23.7%
jan 1, 2002
0.895
-0.489
-35.35%
jan 1, 2003
0.937
+0.042
4.71%
jan 1, 2004
1.012
+0.075
7.96%
jan 1, 2005
1.226
+0.215
21.21%
jan 1, 2006
1.579
+0.353
28.79%
jan 1, 2007
1.675
+0.096
6.05%
jan 1, 2008
1.552
-0.123
-7.32%
jan 1, 2009
1.864
+0.312
20.1%
jan 1, 2010
1.777
-0.087
-4.66%
jan 1, 2011
2.431
+0.654
36.81%
jan 1, 2012
2.14
-0.291
-11.97%
jan 1, 2013
2.4
+0.259
12.12%
jan 1, 2014
2.597
+0.198
8.25%
jan 1, 2015
3.401
+0.803
30.92%
Ranking of countries by current statistics by years


Comments: