29
/
en
AIzaSyAYiBZKx7MnpbEhh9jyipgxe19OcubqV5w
April 1, 2024
171942
Kuwait
KWT
true
2
1
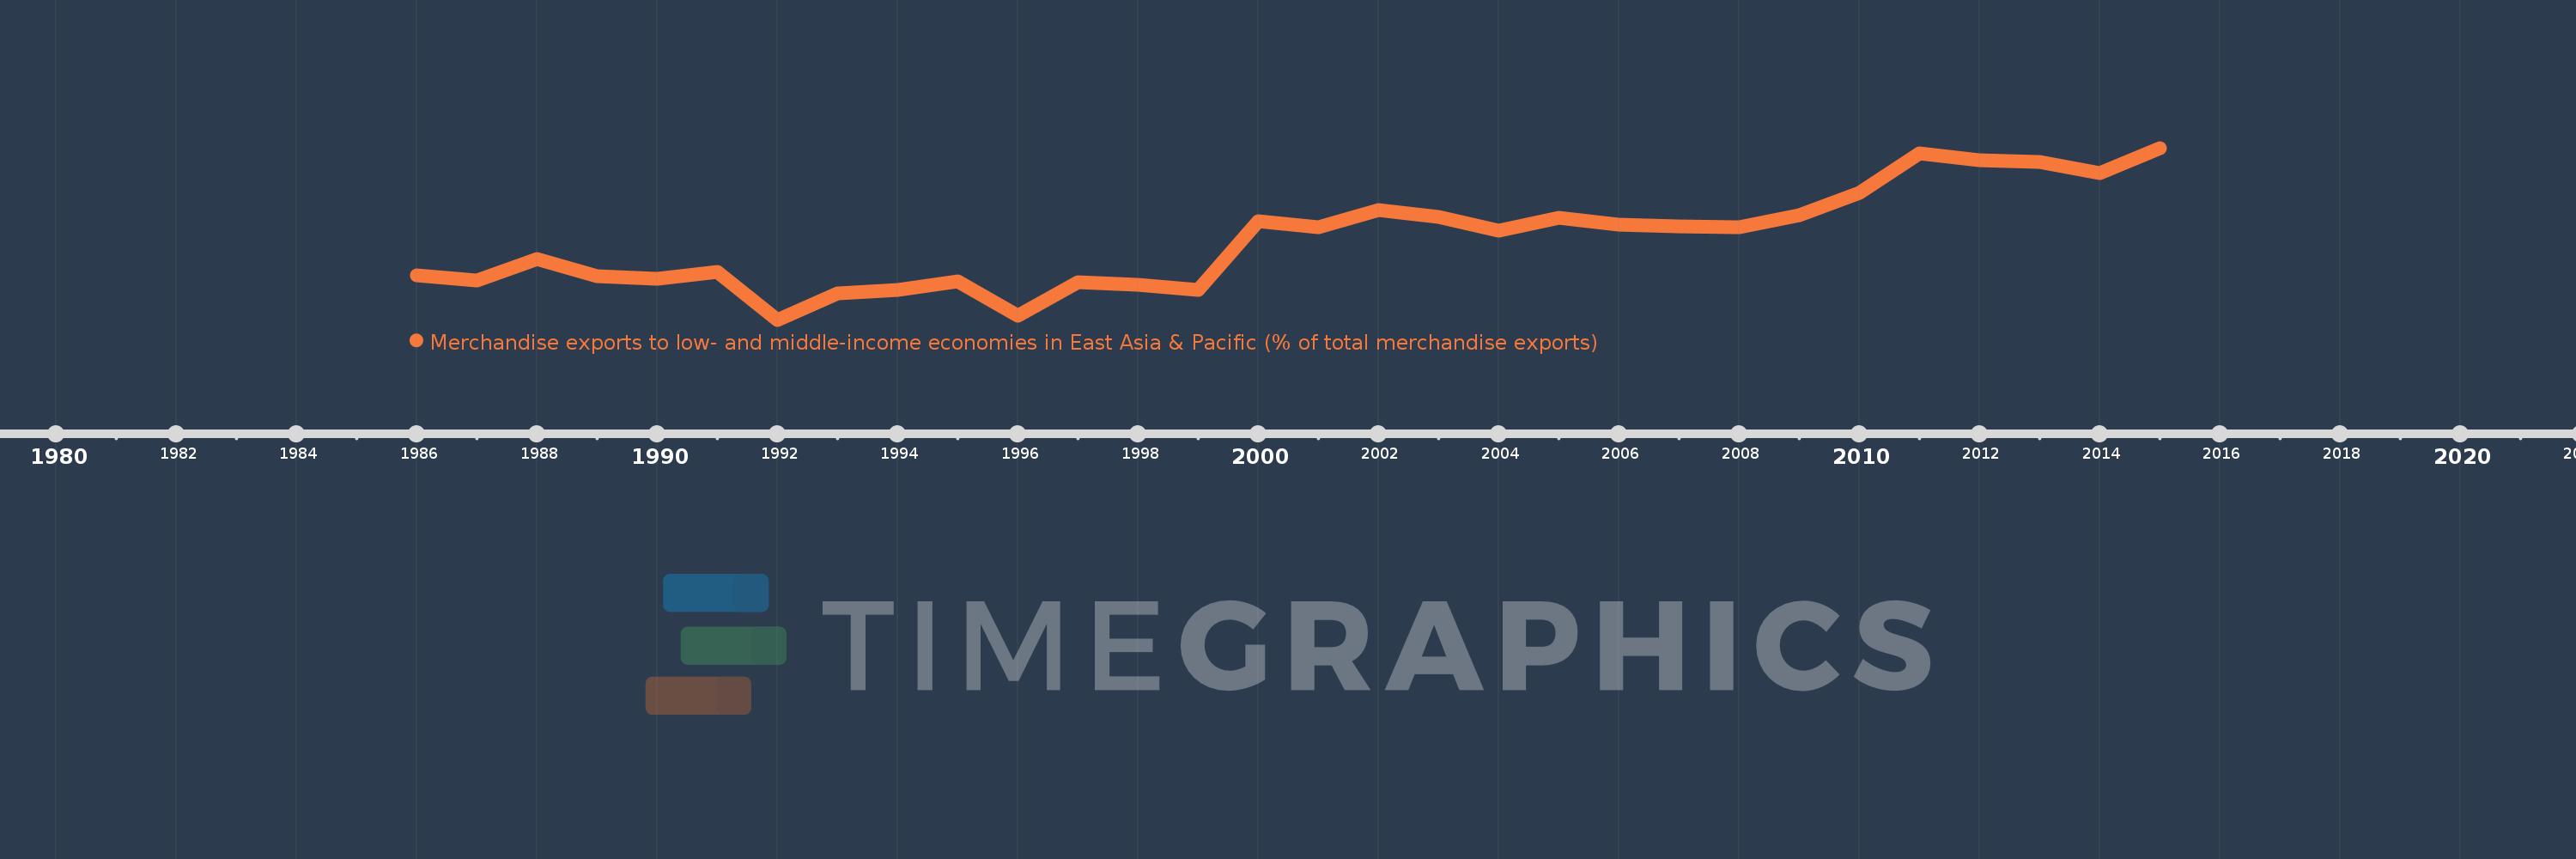
Merchandise exports to low- and middle-income economies in East Asia & Pacific (% of total merchandise exports)
2015,2014,2013,2012,2011,2010,2009,2008,2007,2006,2005,2004,2003,2002,2001,2000,1999,1998,1997,1996,1995,1994,1993,1992,1991,1990,1989,1988,1987,1986
This statistics in other country:
AfghanistanAlbaniaAlgeriaArab WorldArgentinaAustraliaAustriaAzerbaijanBahamas, TheBahrainBangladeshBarbadosBelarusBelgiumBermudaBrazilBrunei DarussalamBulgariaCabo VerdeCambodiaCameroonCanadaCaribbean small statesCentral Europe and the BalticsChileChinaColombiaCosta RicaCote d'IvoireCroatiaCubaCyprusCzech RepublicDenmarkDominicaDominican RepublicEarly-demographic dividendEast Asia & PacificEast Asia & Pacific (excluding high income)East Asia & Pacific (IDA & IBRD countries)EcuadorEgypt, Arab Rep.El SalvadorEstoniaEthiopiaEuro areaEurope & Central AsiaEurope & Central Asia (excluding high income)Europe & Central Asia (IDA & IBRD countries)European UnionFijiFinlandFragile and conflict affected situationsFranceGermanyGhanaGreeceGuatemalaGuyanaHeavily indebted poor countries (HIPC)High incomeHondurasHong Kong SAR, ChinaHungaryIBRD onlyIcelandIDA & IBRD totalIDA blendIDA onlyIDA totalIndiaIndonesiaIran, Islamic Rep.IraqIrelandIsraelItalyJamaicaJapanJordanKazakhstanKenyaKorea, Dem. People’s Rep.Korea, Rep.KuwaitLate-demographic dividendLatin America & Caribbean Latin America & Caribbean (excluding high income)Latin America & the Caribbean (IDA & IBRD countries)LatviaLeast developed countries: UN classificationLebanonLithuaniaLow & middle incomeLow incomeLower middle incomeLuxembourgMacao SAR, ChinaMacedonia, FYRMadagascarMalaysiaMaltaMauritiusMexicoMiddle East & North AfricaMiddle East & North Africa (excluding high income)Middle East & North Africa (IDA & IBRD countries)Middle incomeMoldovaMontenegroMoroccoMozambiqueMyanmarNetherlandsNew CaledoniaNew ZealandNigeriaNorth AmericaNorwayOECD membersOmanOther small statesPacific island small statesPakistanPapua New GuineaParaguayPeruPhilippinesPolandPortugalPost-demographic dividendPre-demographic dividendQatarRomaniaRussian FederationSaudi ArabiaSenegalSerbiaSingaporeSlovak RepublicSloveniaSmall statesSolomon IslandsSomaliaSouth AfricaSouth AsiaSouth Asia (IDA & IBRD)SpainSri LankaSt. LuciaSub-Saharan Africa Sub-Saharan Africa (excluding high income)Sub-Saharan Africa (IDA & IBRD countries)SurinameSwedenSwitzerlandSyrian Arab RepublicTanzaniaThailandTogoTongaTrinidad and TobagoTunisiaTurkeyUgandaUkraineUnited Arab EmiratesUnited KingdomUnited StatesUpper middle incomeVenezuela, RBVietnamWorldYemen, Rep.ZambiaZimbabwe Timeline:
This timeline shows a graph from 1986 to 2015 of Kuwait. No data until 1985. Number of actual observations by date: 30.
Source name:
World Development Indicators
Source organization:
World Bank staff estimates based data from International Monetary Fund's Direction of Trade database.
Categories, topics:
Private Sector, Trade
Last updated:
apr 23, 2017
Indicators value changes by year
Maximum:
14.418
jan 1, 2015
At the date of observation
Value
Absolute change
Change from previous value
jan 1, 1986
4.199
+4.199
0.0%
jan 1, 1987
3.807
-0.392
-9.33%
jan 1, 1988
5.532
+1.725
45.3%
jan 1, 1989
4.125
-1.407
-25.43%
jan 1, 1990
3.934
-0.192
-4.65%
jan 1, 1991
4.486
+0.552
14.03%
jan 1, 1992
0.672
-3.814
-85.03%
jan 1, 1993
2.807
+2.136
318.03%
jan 1, 1994
3.034
+0.227
8.07%
jan 1, 1995
3.778
+0.744
24.54%
jan 1, 1996
0.962
-2.816
-74.53%
jan 1, 1997
3.657
+2.694
279.98%
jan 1, 1998
3.44
-0.217
-5.94%
jan 1, 1999
3.078
-0.361
-10.5%
jan 1, 2000
8.524
+5.446
176.92%
jan 1, 2001
8.048
-0.476
-5.58%
jan 1, 2002
9.426
+1.378
17.12%
jan 1, 2003
8.886
-0.541
-5.73%
jan 1, 2004
7.799
-1.087
-12.24%
jan 1, 2005
8.849
+1.051
13.47%
jan 1, 2006
8.264
-0.585
-6.61%
jan 1, 2007
8.144
-0.121
-1.46%
jan 1, 2008
8.087
-0.056
-0.69%
jan 1, 2009
9.02
+0.933
11.53%
jan 1, 2010
10.835
+1.815
20.12%
jan 1, 2011
13.985
+3.15
29.07%
jan 1, 2012
13.408
-0.577
-4.13%
jan 1, 2013
13.268
-0.14
-1.04%
jan 1, 2014
12.374
-0.894
-6.74%
jan 1, 2015
14.418
+2.044
16.52%
Ranking of countries by current statistics by years


Comments: