29
/
en
AIzaSyAYiBZKx7MnpbEhh9jyipgxe19OcubqV5w
April 1, 2024
222471
Peru
PER
true
2
1
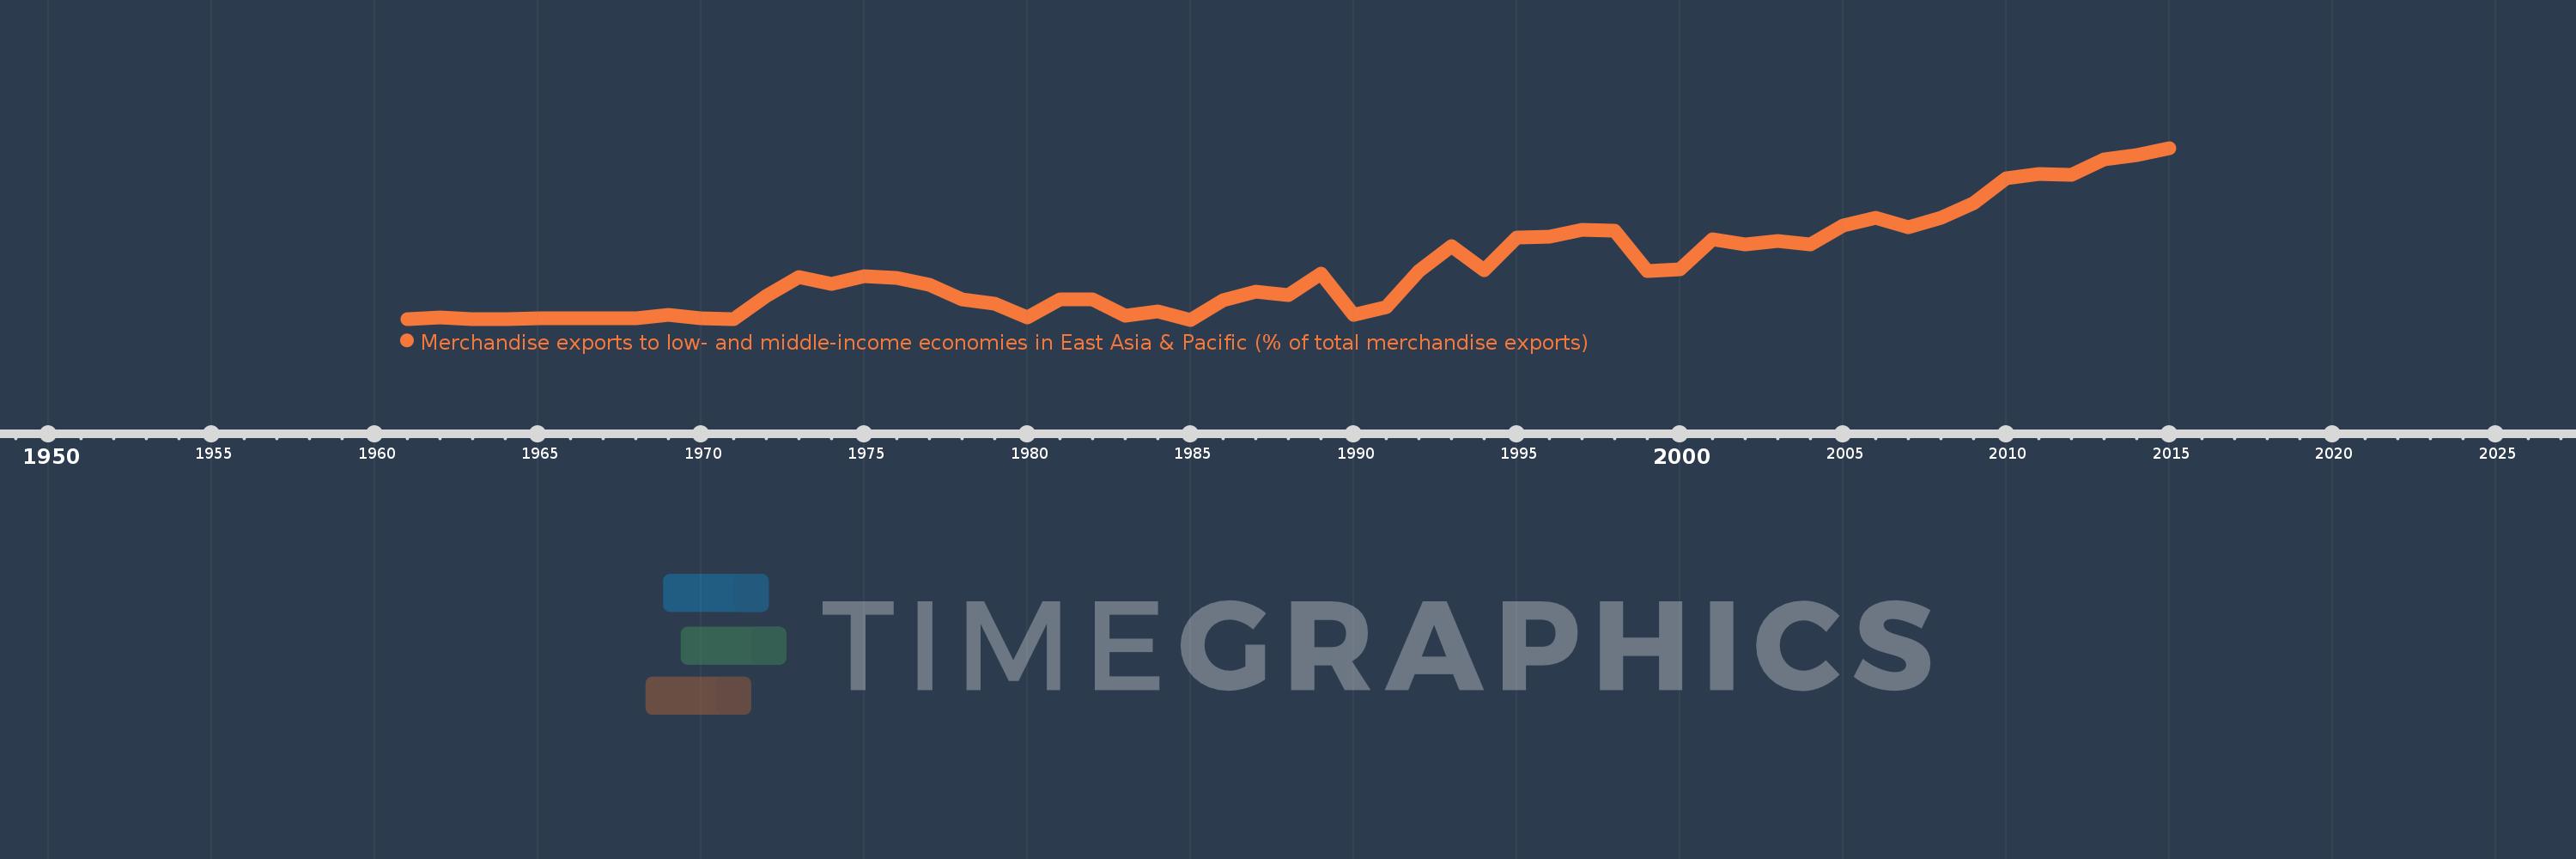
Merchandise exports to low- and middle-income economies in East Asia & Pacific (% of total merchandise exports)
2015,2014,2013,2012,2011,2010,2009,2008,2007,2006,2005,2004,2003,2002,2001,2000,1999,1998,1997,1996,1995,1994,1993,1992,1991,1990,1989,1988,1987,1986,1985,1984,1983,1982,1981,1980,1979,1978,1977,1976,1975,1974,1973,1972,1971,1970,1969,1968,1967,1966,1965,1964,1963,1962,1961
This statistics in other country:
AfghanistanAlbaniaAlgeriaArab WorldArgentinaAustraliaAustriaAzerbaijanBahamas, TheBahrainBangladeshBarbadosBelarusBelgiumBermudaBrazilBrunei DarussalamBulgariaCabo VerdeCambodiaCameroonCanadaCaribbean small statesCentral Europe and the BalticsChileChinaColombiaCosta RicaCote d'IvoireCroatiaCubaCyprusCzech RepublicDenmarkDominicaDominican RepublicEarly-demographic dividendEast Asia & PacificEast Asia & Pacific (excluding high income)East Asia & Pacific (IDA & IBRD countries)EcuadorEgypt, Arab Rep.El SalvadorEstoniaEthiopiaEuro areaEurope & Central AsiaEurope & Central Asia (excluding high income)Europe & Central Asia (IDA & IBRD countries)European UnionFijiFinlandFragile and conflict affected situationsFranceGermanyGhanaGreeceGuatemalaGuyanaHeavily indebted poor countries (HIPC)High incomeHondurasHong Kong SAR, ChinaHungaryIBRD onlyIcelandIDA & IBRD totalIDA blendIDA onlyIDA totalIndiaIndonesiaIran, Islamic Rep.IraqIrelandIsraelItalyJamaicaJapanJordanKazakhstanKenyaKorea, Dem. People’s Rep.Korea, Rep.KuwaitLate-demographic dividendLatin America & Caribbean Latin America & Caribbean (excluding high income)Latin America & the Caribbean (IDA & IBRD countries)LatviaLeast developed countries: UN classificationLebanonLithuaniaLow & middle incomeLow incomeLower middle incomeLuxembourgMacao SAR, ChinaMacedonia, FYRMadagascarMalaysiaMaltaMauritiusMexicoMiddle East & North AfricaMiddle East & North Africa (excluding high income)Middle East & North Africa (IDA & IBRD countries)Middle incomeMoldovaMontenegroMoroccoMozambiqueMyanmarNetherlandsNew CaledoniaNew ZealandNigeriaNorth AmericaNorwayOECD membersOmanOther small statesPacific island small statesPakistanPapua New GuineaParaguayPeruPhilippinesPolandPortugalPost-demographic dividendPre-demographic dividendQatarRomaniaRussian FederationSaudi ArabiaSenegalSerbiaSingaporeSlovak RepublicSloveniaSmall statesSolomon IslandsSomaliaSouth AfricaSouth AsiaSouth Asia (IDA & IBRD)SpainSri LankaSt. LuciaSub-Saharan Africa Sub-Saharan Africa (excluding high income)Sub-Saharan Africa (IDA & IBRD countries)SurinameSwedenSwitzerlandSyrian Arab RepublicTanzaniaThailandTogoTongaTrinidad and TobagoTunisiaTurkeyUgandaUkraineUnited Arab EmiratesUnited KingdomUnited StatesUpper middle incomeVenezuela, RBVietnamWorldYemen, Rep.ZambiaZimbabwe Timeline:
This timeline shows a graph from 1961 to 2015 of Peru. No data until 1960. Number of actual observations by date: 55.
Source name:
World Development Indicators
Source organization:
World Bank staff estimates based data from International Monetary Fund's Direction of Trade database.
Categories, topics:
Private Sector, Trade
Last updated:
apr 23, 2017
Indicators value changes by year
Maximum:
19.459
jan 1, 2015
At the date of observation
Value
Absolute change
Change from previous value
jan 1, 1961
0.049
+0.049
0.0%
jan 1, 1962
0.273
+0.224
457.88%
jan 1, 1963
0.114
-0.159
-58.19%
jan 1, 1964
0.056
-0.058
-51.08%
jan 1, 1965
0.15
+0.094
168.49%
jan 1, 1966
0.135
-0.015
-10.05%
jan 1, 1967
0.131
-0.004
-3.1%
jan 1, 1968
0.181
+0.05
38.46%
jan 1, 1969
0.591
+0.41
226.49%
jan 1, 1970
0.224
-0.366
-62.02%
jan 1, 1971
0.098
-0.126
-56.18%
jan 1, 1972
2.696
+2.598
2.64K%
jan 1, 1973
4.809
+2.113
78.36%
jan 1, 1974
4.103
-0.706
-14.68%
jan 1, 1975
4.958
+0.856
20.85%
jan 1, 1976
4.729
-0.23
-4.63%
jan 1, 1977
3.93
-0.799
-16.89%
jan 1, 1978
2.34
-1.59
-40.45%
jan 1, 1979
1.859
-0.482
-20.58%
jan 1, 1980
0.287
-1.572
-84.59%
jan 1, 1981
2.355
+2.069
722.14%
jan 1, 1982
2.319
-0.036
-1.54%
jan 1, 1983
0.506
-1.813
-78.17%
jan 1, 1984
0.961
+0.454
89.73%
jan 1, 1985
0.012
-0.949
-98.75%
jan 1, 1986
2.222
+2.21
18.44K%
jan 1, 1987
3.158
+0.936
42.12%
jan 1, 1988
2.805
-0.353
-11.19%
jan 1, 1989
5.235
+2.431
86.67%
jan 1, 1990
0.573
-4.663
-89.06%
jan 1, 1991
1.48
+0.907
158.37%
jan 1, 1992
5.567
+4.088
276.29%
jan 1, 1993
8.323
+2.756
49.5%
jan 1, 1994
5.579
-2.744
-32.97%
jan 1, 1995
9.321
+3.742
67.08%
jan 1, 1996
9.427
+0.106
1.14%
jan 1, 1997
10.232
+0.805
8.54%
jan 1, 1998
10.127
-0.105
-1.03%
jan 1, 1999
5.478
-4.649
-45.91%
jan 1, 2000
5.675
+0.197
3.6%
jan 1, 2001
9.093
+3.418
60.23%
jan 1, 2002
8.522
-0.571
-6.28%
jan 1, 2003
8.921
+0.4
4.69%
jan 1, 2004
8.566
-0.355
-3.98%
jan 1, 2005
10.711
+2.145
25.04%
jan 1, 2006
11.525
+0.814
7.6%
jan 1, 2007
10.469
-1.056
-9.16%
jan 1, 2008
11.57
+1.101
10.51%
jan 1, 2009
13.186
+1.616
13.96%
jan 1, 2010
16.073
+2.887
21.9%
jan 1, 2011
16.507
+0.434
2.7%
jan 1, 2012
16.388
-0.119
-0.72%
jan 1, 2013
18.211
+1.823
11.12%
jan 1, 2014
18.653
+0.442
2.43%
jan 1, 2015
19.459
+0.806
4.32%
Ranking of countries by current statistics by years


Comments: