29
/
en
AIzaSyAYiBZKx7MnpbEhh9jyipgxe19OcubqV5w
April 1, 2024
47343
Lower middle income
LMC
false
2
1
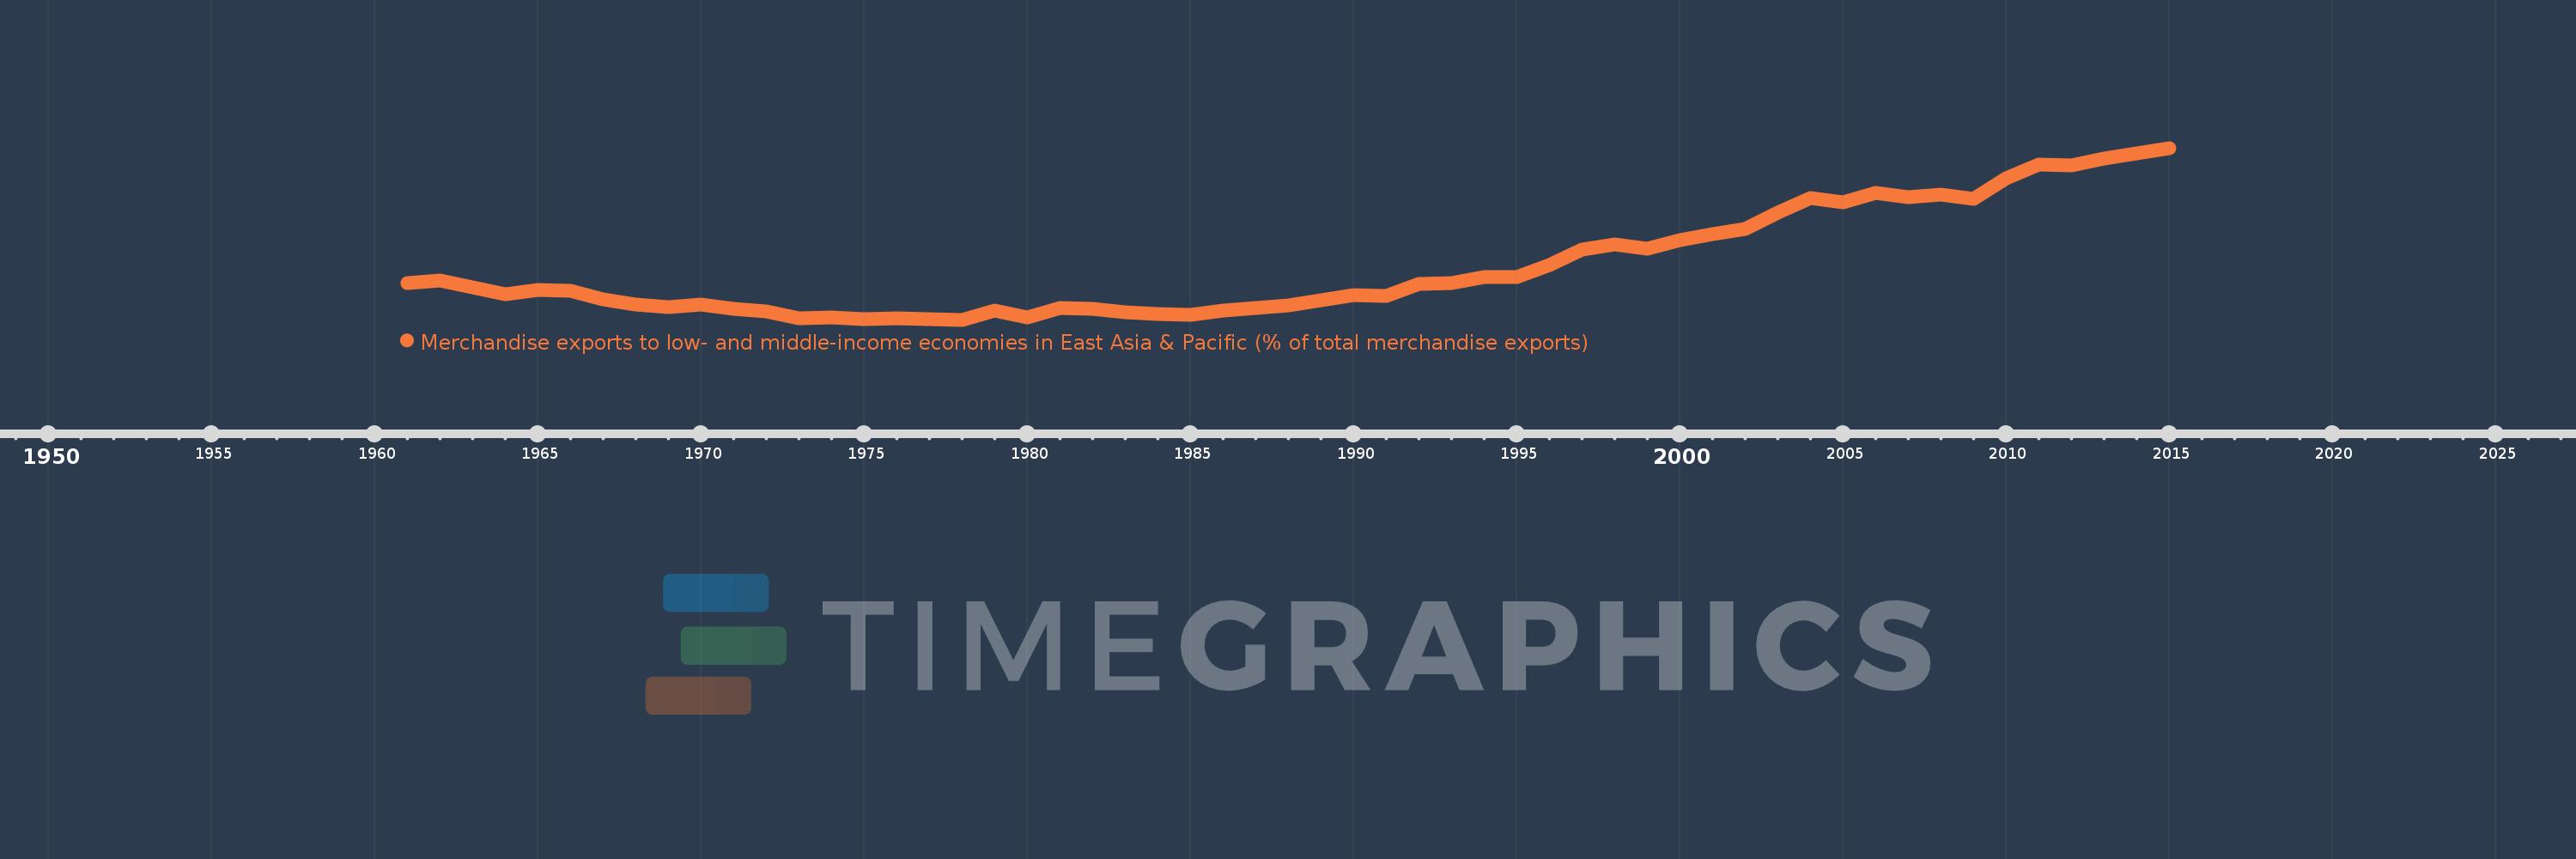
Merchandise exports to low- and middle-income economies in East Asia & Pacific (% of total merchandise exports)
2015,2014,2013,2012,2011,2010,2009,2008,2007,2006,2005,2004,2003,2002,2001,2000,1999,1998,1997,1996,1995,1994,1993,1992,1991,1990,1989,1988,1987,1986,1985,1984,1983,1982,1981,1980,1979,1978,1977,1976,1975,1974,1973,1972,1971,1970,1969,1968,1967,1966,1965,1964,1963,1962,1961
This statistics in other country:
AfghanistanAlbaniaAlgeriaArab WorldArgentinaAustraliaAustriaAzerbaijanBahamas, TheBahrainBangladeshBarbadosBelarusBelgiumBermudaBrazilBrunei DarussalamBulgariaCabo VerdeCambodiaCameroonCanadaCaribbean small statesCentral Europe and the BalticsChileChinaColombiaCosta RicaCote d'IvoireCroatiaCubaCyprusCzech RepublicDenmarkDominicaDominican RepublicEarly-demographic dividendEast Asia & PacificEast Asia & Pacific (excluding high income)East Asia & Pacific (IDA & IBRD countries)EcuadorEgypt, Arab Rep.El SalvadorEstoniaEthiopiaEuro areaEurope & Central AsiaEurope & Central Asia (excluding high income)Europe & Central Asia (IDA & IBRD countries)European UnionFijiFinlandFragile and conflict affected situationsFranceGermanyGhanaGreeceGuatemalaGuyanaHeavily indebted poor countries (HIPC)High incomeHondurasHong Kong SAR, ChinaHungaryIBRD onlyIcelandIDA & IBRD totalIDA blendIDA onlyIDA totalIndiaIndonesiaIran, Islamic Rep.IraqIrelandIsraelItalyJamaicaJapanJordanKazakhstanKenyaKorea, Dem. People’s Rep.Korea, Rep.KuwaitLate-demographic dividendLatin America & Caribbean Latin America & Caribbean (excluding high income)Latin America & the Caribbean (IDA & IBRD countries)LatviaLeast developed countries: UN classificationLebanonLithuaniaLow & middle incomeLow incomeLower middle incomeLuxembourgMacao SAR, ChinaMacedonia, FYRMadagascarMalaysiaMaltaMauritiusMexicoMiddle East & North AfricaMiddle East & North Africa (excluding high income)Middle East & North Africa (IDA & IBRD countries)Middle incomeMoldovaMontenegroMoroccoMozambiqueMyanmarNetherlandsNew CaledoniaNew ZealandNigeriaNorth AmericaNorwayOECD membersOmanOther small statesPacific island small statesPakistanPapua New GuineaParaguayPeruPhilippinesPolandPortugalPost-demographic dividendPre-demographic dividendQatarRomaniaRussian FederationSaudi ArabiaSenegalSerbiaSingaporeSlovak RepublicSloveniaSmall statesSolomon IslandsSomaliaSouth AfricaSouth AsiaSouth Asia (IDA & IBRD)SpainSri LankaSt. LuciaSub-Saharan Africa Sub-Saharan Africa (excluding high income)Sub-Saharan Africa (IDA & IBRD countries)SurinameSwedenSwitzerlandSyrian Arab RepublicTanzaniaThailandTogoTongaTrinidad and TobagoTunisiaTurkeyUgandaUkraineUnited Arab EmiratesUnited KingdomUnited StatesUpper middle incomeVenezuela, RBVietnamWorldYemen, Rep.ZambiaZimbabwe Timeline:
This timeline shows a graph from 1961 to 2015 of Lower middle income. No data until 1960. Number of actual observations by date: 55.
Source name:
World Development Indicators
Source organization:
World Bank staff estimates based data from International Monetary Fund's Direction of Trade database.
Categories, topics:
Private Sector, Trade
Last updated:
apr 23, 2017
Indicators value changes by year
Maximum:
14.245
jan 1, 2015
At the date of observation
Value
Absolute change
Change from previous value
jan 1, 1961
4.139
+4.139
0.0%
jan 1, 1962
4.356
+0.216
5.23%
jan 1, 1963
3.858
-0.498
-11.42%
jan 1, 1964
3.318
-0.541
-14.01%
jan 1, 1965
3.669
+0.351
10.58%
jan 1, 1966
3.604
-0.064
-1.75%
jan 1, 1967
2.937
-0.667
-18.5%
jan 1, 1968
2.594
-0.343
-11.69%
jan 1, 1969
2.358
-0.236
-9.08%
jan 1, 1970
2.571
+0.212
9.01%
jan 1, 1971
2.225
-0.346
-13.47%
jan 1, 1972
2.074
-0.151
-6.77%
jan 1, 1973
1.52
-0.554
-26.73%
jan 1, 1974
1.603
+0.083
5.46%
jan 1, 1975
1.48
-0.123
-7.65%
jan 1, 1976
1.518
+0.038
2.59%
jan 1, 1977
1.466
-0.053
-3.46%
jan 1, 1978
1.432
-0.033
-2.28%
jan 1, 1979
2.104
+0.671
46.87%
jan 1, 1980
1.617
-0.487
-23.13%
jan 1, 1981
2.324
+0.707
43.69%
jan 1, 1982
2.25
-0.074
-3.18%
jan 1, 1983
2.004
-0.246
-10.94%
jan 1, 1984
1.887
-0.117
-5.83%
jan 1, 1985
1.781
-0.106
-5.62%
jan 1, 1986
2.104
+0.323
18.16%
jan 1, 1987
2.299
+0.195
9.25%
jan 1, 1988
2.521
+0.222
9.68%
jan 1, 1989
2.892
+0.37
14.69%
jan 1, 1990
3.272
+0.38
13.16%
jan 1, 1991
3.203
-0.07
-2.13%
jan 1, 1992
4.134
+0.931
29.07%
jan 1, 1993
4.162
+0.028
0.68%
jan 1, 1994
4.644
+0.482
11.59%
jan 1, 1995
4.6
-0.044
-0.95%
jan 1, 1996
5.529
+0.929
20.19%
jan 1, 1997
6.65
+1.121
20.28%
jan 1, 1998
7.044
+0.394
5.92%
jan 1, 1999
6.714
-0.33
-4.68%
jan 1, 2000
7.399
+0.685
10.2%
jan 1, 2001
7.837
+0.439
5.93%
jan 1, 2002
8.226
+0.389
4.96%
jan 1, 2003
9.426
+1.2
14.58%
jan 1, 2004
10.494
+1.069
11.34%
jan 1, 2005
10.192
-0.302
-2.88%
jan 1, 2006
10.908
+0.715
7.02%
jan 1, 2007
10.564
-0.344
-3.16%
jan 1, 2008
10.771
+0.208
1.97%
jan 1, 2009
10.466
-0.305
-2.83%
jan 1, 2010
11.99
+1.523
14.55%
jan 1, 2011
12.99
+1.0
8.34%
jan 1, 2012
12.969
-0.021
-0.16%
jan 1, 2013
13.45
+0.481
3.7%
jan 1, 2014
13.835
+0.385
2.86%
jan 1, 2015
14.245
+0.41
2.97%
Ranking of countries by current statistics by years


Comments: