29
/
en
AIzaSyAYiBZKx7MnpbEhh9jyipgxe19OcubqV5w
April 1, 2024
76517
Bahamas, The
BHS
true
2
1
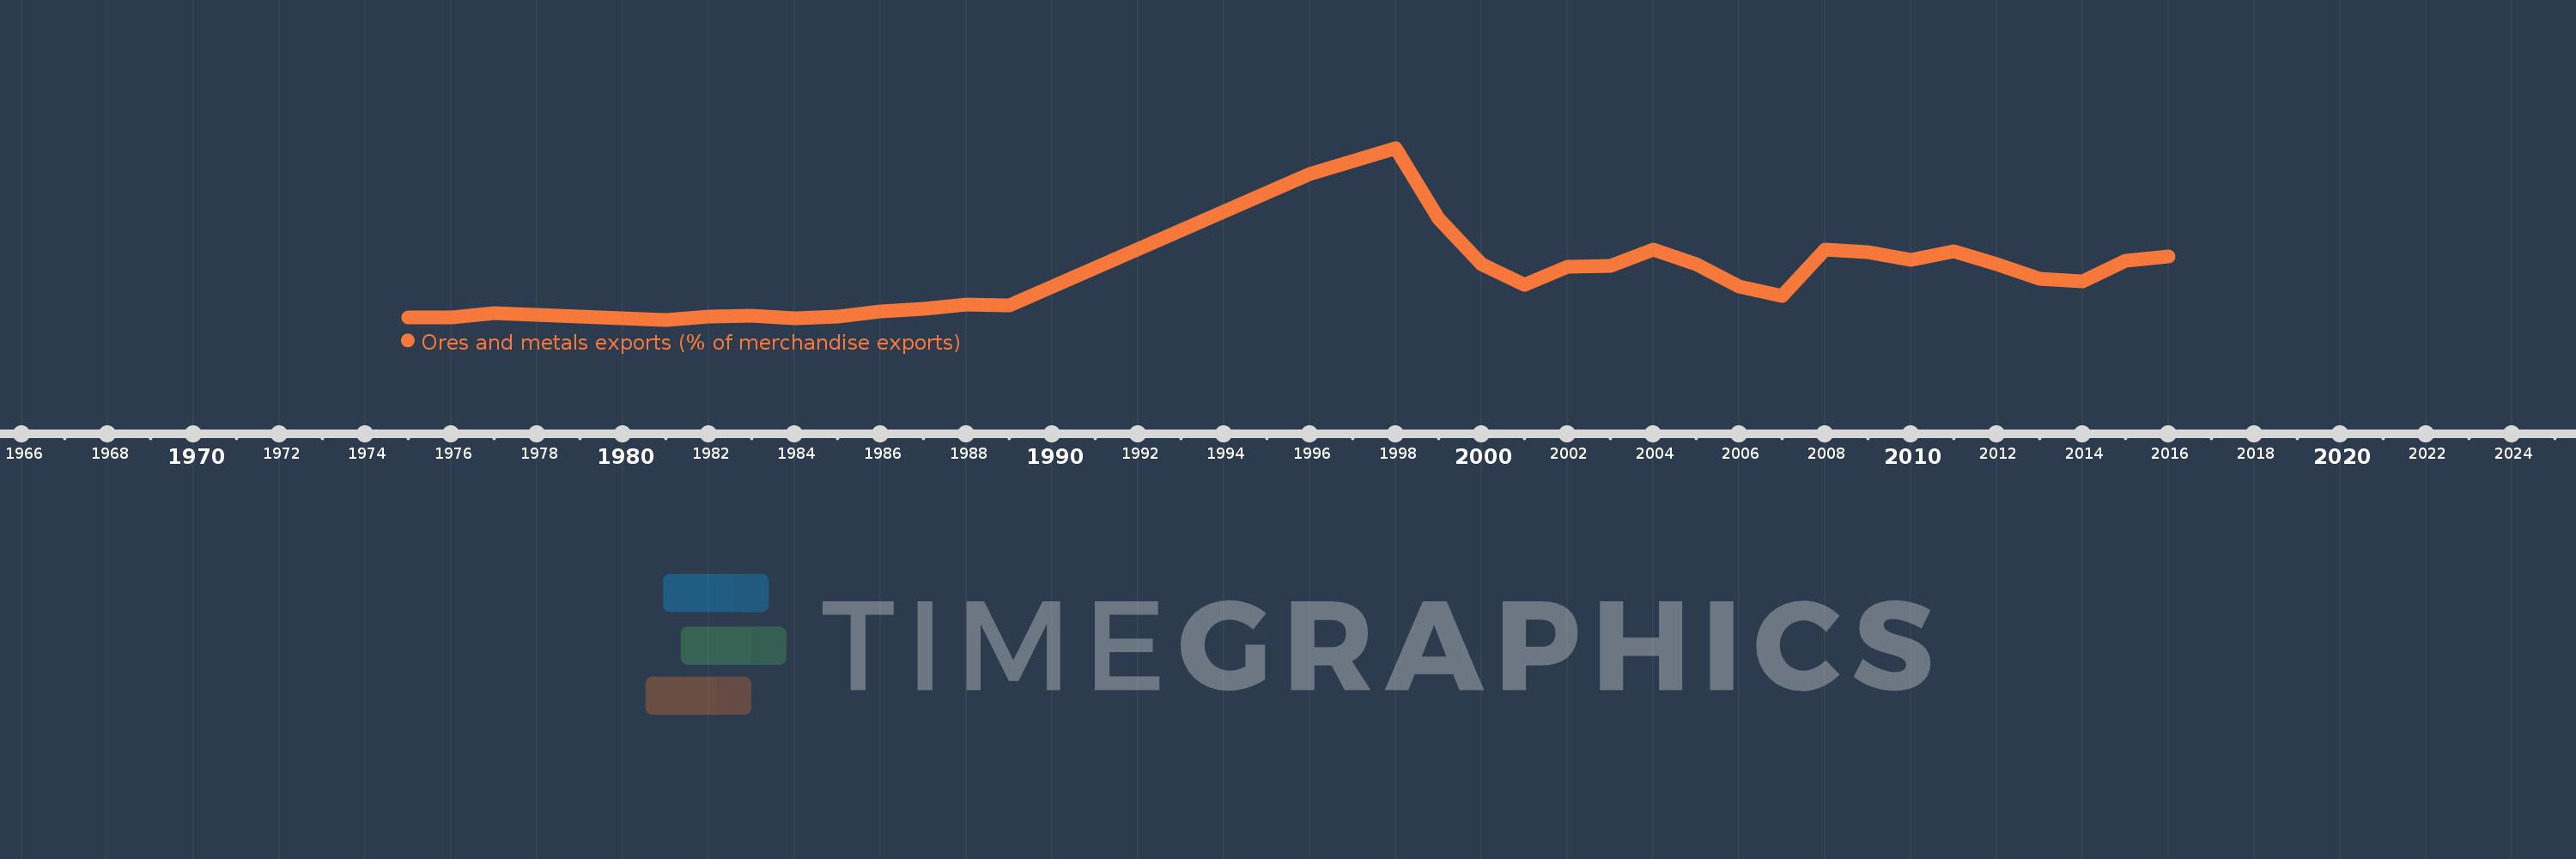
Ores and metals exports (% of merchandise exports)
2016,2015,2014,2013,2012,2011,2010,2009,2008,2007,2006,2005,2004,2003,2002,2001,2000,1999,1998,1996,1989,1988,1987,1986,1985,1984,1983,1982,1981,1977,1976,1975
This statistics in other country:
AfghanistanAlbaniaAlgeriaAndorraAngolaAntigua and BarbudaArab WorldArgentinaArmeniaArubaAustraliaAustriaAzerbaijanBahamas, TheBahrainBangladeshBarbadosBelarusBelgiumBelizeBeninBermudaBhutanBoliviaBosnia and HerzegovinaBotswanaBrazilBrunei DarussalamBulgariaBurkina FasoBurundiCabo VerdeCambodiaCameroonCanadaCaribbean small statesCayman IslandsCentral African RepublicCentral Europe and the BalticsChadChileChinaColombiaComorosCongo, Dem. Rep.Congo, Rep.Costa RicaCote d'IvoireCroatiaCubaCyprusCzech RepublicDenmarkDjiboutiDominicaDominican RepublicEarly-demographic dividendEast Asia & PacificEast Asia & Pacific (excluding high income)East Asia & Pacific (IDA & IBRD countries)EcuadorEgypt, Arab Rep.El SalvadorEquatorial GuineaEritreaEstoniaEthiopiaEuro areaEurope & Central AsiaEurope & Central Asia (excluding high income)Europe & Central Asia (IDA & IBRD countries)European UnionFaroe IslandsFijiFinlandFragile and conflict affected situationsFranceFrench PolynesiaGabonGambia, TheGeorgiaGermanyGhanaGreeceGreenlandGrenadaGuatemalaGuineaGuinea-BissauGuyanaHaitiHeavily indebted poor countries (HIPC)High incomeHondurasHong Kong SAR, ChinaHungaryIBRD onlyIcelandIDA & IBRD totalIDA blendIDA onlyIDA totalIndiaIndonesiaIran, Islamic Rep.IraqIrelandIsraelItalyJamaicaJapanJordanKazakhstanKenyaKiribatiKorea, Rep.KuwaitKyrgyz RepublicLao PDRLate-demographic dividendLatin America & Caribbean Latin America & Caribbean (excluding high income)Latin America & the Caribbean (IDA & IBRD countries)LatviaLeast developed countries: UN classificationLebanonLesothoLiberiaLibyaLithuaniaLow & middle incomeLower middle incomeLuxembourgMacao SAR, ChinaMacedonia, FYRMadagascarMalawiMalaysiaMaldivesMaliMaltaMauritaniaMauritiusMexicoMiddle East & North AfricaMiddle East & North Africa (excluding high income)Middle East & North Africa (IDA & IBRD countries)Middle incomeMoldovaMongoliaMoroccoMozambiqueMyanmarNamibiaNepalNetherlandsNew CaledoniaNew ZealandNicaraguaNigerNigeriaNorth AmericaNorwayOECD membersOmanOther small statesPacific island small statesPakistanPalauPanamaPapua New GuineaParaguayPeruPhilippinesPolandPortugalPost-demographic dividendPre-demographic dividendQatarRomaniaRussian FederationRwandaSamoaSao Tome and PrincipeSaudi ArabiaSenegalSerbiaSeychellesSierra LeoneSingaporeSlovak RepublicSloveniaSmall statesSolomon IslandsSomaliaSouth AfricaSouth AsiaSouth Asia (IDA & IBRD)SpainSri LankaSt. Kitts and NevisSt. LuciaSt. Vincent and the GrenadinesSub-Saharan Africa Sub-Saharan Africa (excluding high income)Sub-Saharan Africa (IDA & IBRD countries)SudanSurinameSwazilandSwedenSwitzerlandSyrian Arab RepublicTajikistanTanzaniaThailandTimor-LesteTogoTongaTrinidad and TobagoTunisiaTurkeyTurkmenistanTurks and Caicos IslandsUgandaUkraineUnited Arab EmiratesUnited KingdomUnited StatesUpper middle incomeUruguayVanuatuVenezuela, RBVietnamVirgin Islands (U.S.)WorldYemen, Rep.ZambiaZimbabwe Timeline:
This timeline shows a graph from 1975 to 2016 of Bahamas, The. No data until 1974. Number of actual observations by date: 32.
Source name:
World Development Indicators
Source organization:
World Bank staff estimates from the Comtrade database maintained by the United Nations Statistics Division.
Categories, topics:
Energy & Mining, Private Sector, Trade
Last updated:
apr 23, 2017
Indicators value changes by year
Maximum:
27.159
jan 1, 1998
At the date of observation
Value
Absolute change
Change from previous value
jan 1, 1975
0.747
+0.747
0.0%
jan 1, 1976
0.663
-0.083
-11.18%
jan 1, 1977
1.404
+0.741
111.68%
jan 1, 1981
0.322
-1.082
-77.04%
jan 1, 1982
0.763
+0.441
136.82%
jan 1, 1983
0.942
+0.179
23.45%
jan 1, 1984
0.605
-0.337
-35.81%
jan 1, 1985
0.868
+0.263
43.5%
jan 1, 1986
1.65
+0.782
90.15%
jan 1, 1987
2.001
+0.351
21.25%
jan 1, 1988
2.756
+0.755
37.71%
jan 1, 1989
2.536
-0.22
-7.97%
jan 1, 1996
23.099
+20.562
810.76%
jan 1, 1998
27.159
+4.06
17.58%
jan 1, 1999
16.138
-11.02
-40.58%
jan 1, 2000
8.984
-7.154
-44.33%
jan 1, 2001
5.748
-3.236
-36.02%
jan 1, 2002
8.614
+2.866
49.85%
jan 1, 2003
8.766
+0.152
1.76%
jan 1, 2004
11.287
+2.521
28.75%
jan 1, 2005
9.054
-2.233
-19.78%
jan 1, 2006
5.486
-3.568
-39.41%
jan 1, 2007
3.982
-1.505
-27.42%
jan 1, 2008
11.294
+7.313
183.66%
jan 1, 2009
10.92
-0.375
-3.32%
jan 1, 2010
9.609
-1.311
-12.0%
jan 1, 2011
11.036
+1.427
14.85%
jan 1, 2012
8.999
-2.037
-18.46%
jan 1, 2013
6.712
-2.287
-25.41%
jan 1, 2014
6.255
-0.457
-6.81%
jan 1, 2015
9.525
+3.27
52.28%
jan 1, 2016
10.22
+0.694
7.29%
Ranking of countries by current statistics by years


Comments: