29
/
en
AIzaSyAYiBZKx7MnpbEhh9jyipgxe19OcubqV5w
April 1, 2024
281419
Venezuela, RB
VEN
true
2
1
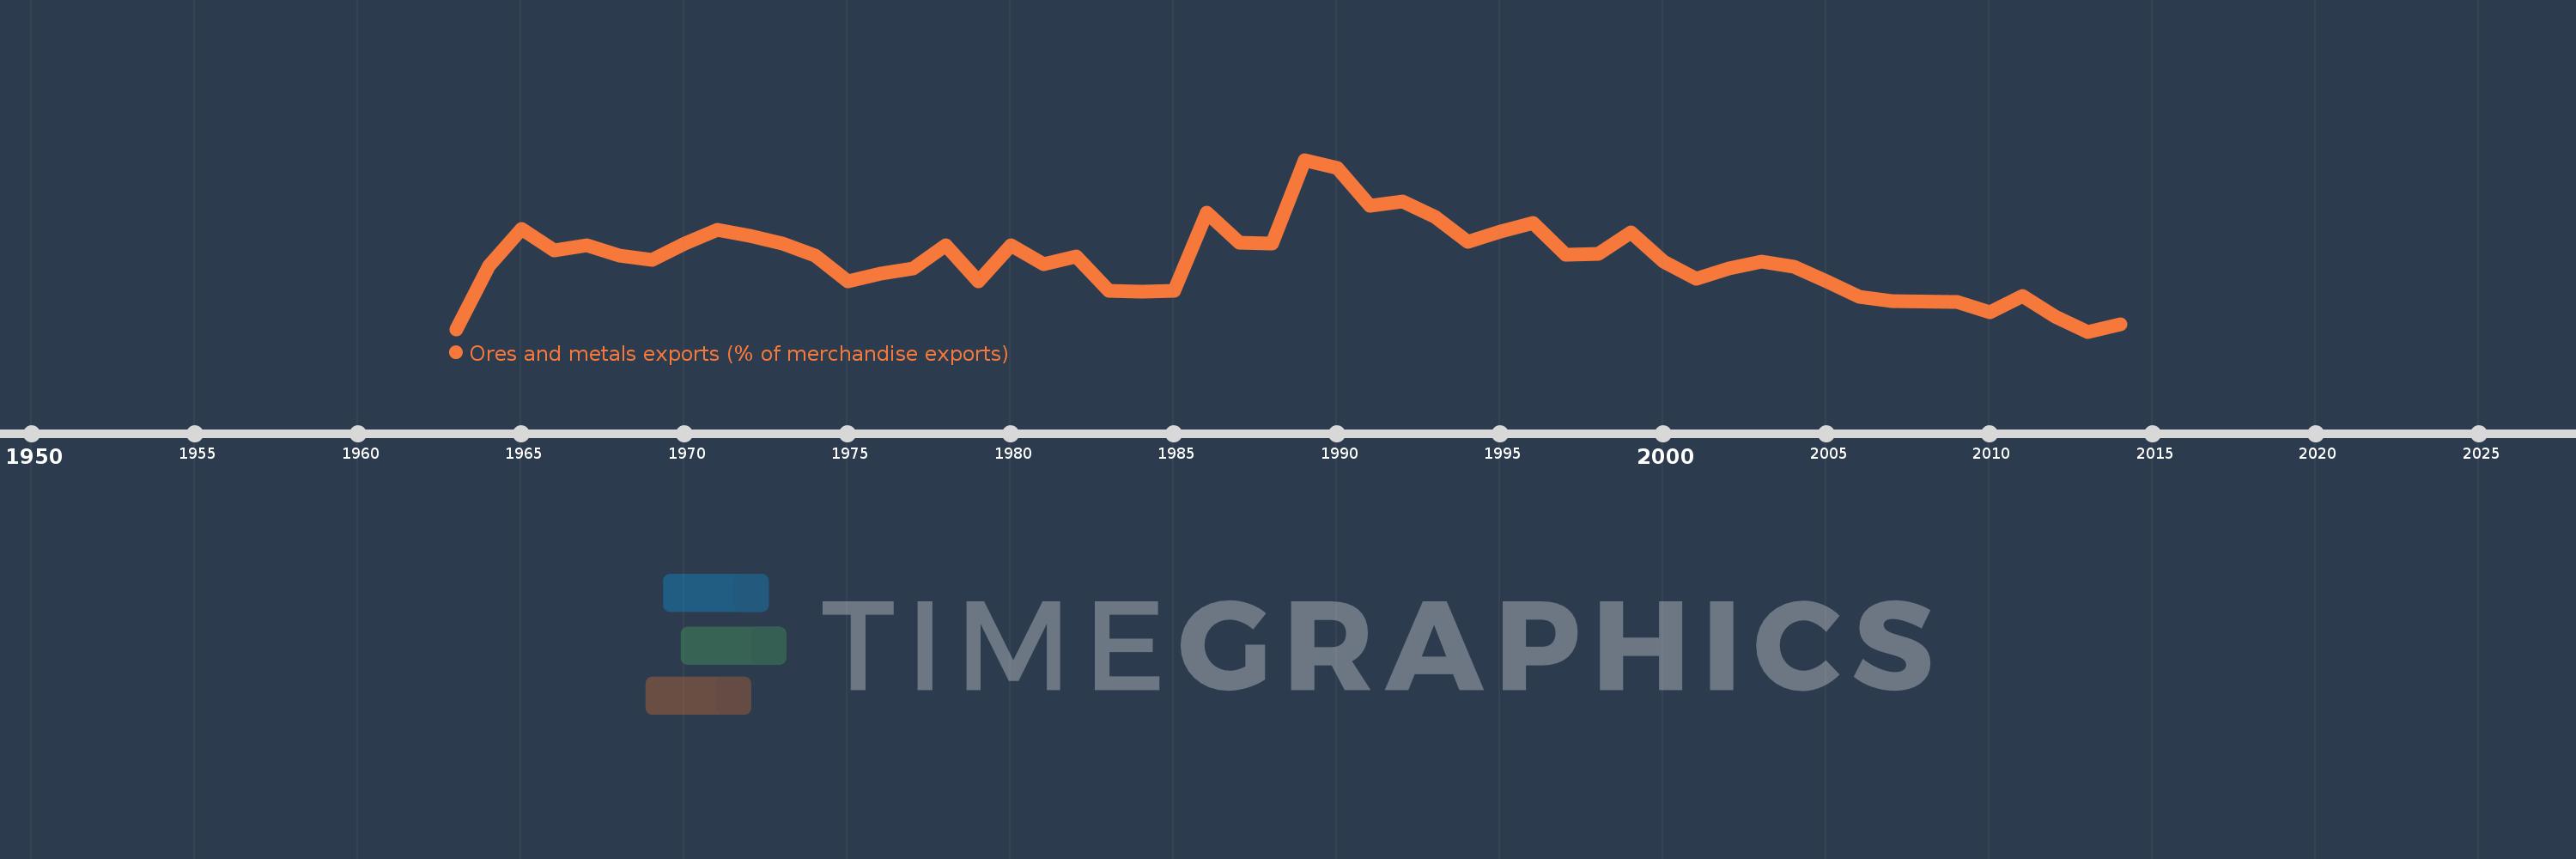
Ores and metals exports (% of merchandise exports)
2014,2013,2012,2011,2010,2009,2007,2006,2005,2004,2003,2002,2001,2000,1999,1998,1997,1996,1995,1994,1993,1992,1991,1990,1989,1988,1987,1986,1985,1984,1983,1982,1981,1980,1979,1978,1977,1976,1975,1974,1973,1972,1971,1970,1969,1968,1967,1966,1965,1964,1963
This statistics in other country:
AfghanistanAlbaniaAlgeriaAndorraAngolaAntigua and BarbudaArab WorldArgentinaArmeniaArubaAustraliaAustriaAzerbaijanBahamas, TheBahrainBangladeshBarbadosBelarusBelgiumBelizeBeninBermudaBhutanBoliviaBosnia and HerzegovinaBotswanaBrazilBrunei DarussalamBulgariaBurkina FasoBurundiCabo VerdeCambodiaCameroonCanadaCaribbean small statesCayman IslandsCentral African RepublicCentral Europe and the BalticsChadChileChinaColombiaComorosCongo, Dem. Rep.Congo, Rep.Costa RicaCote d'IvoireCroatiaCubaCyprusCzech RepublicDenmarkDjiboutiDominicaDominican RepublicEarly-demographic dividendEast Asia & PacificEast Asia & Pacific (excluding high income)East Asia & Pacific (IDA & IBRD countries)EcuadorEgypt, Arab Rep.El SalvadorEquatorial GuineaEritreaEstoniaEthiopiaEuro areaEurope & Central AsiaEurope & Central Asia (excluding high income)Europe & Central Asia (IDA & IBRD countries)European UnionFaroe IslandsFijiFinlandFragile and conflict affected situationsFranceFrench PolynesiaGabonGambia, TheGeorgiaGermanyGhanaGreeceGreenlandGrenadaGuatemalaGuineaGuinea-BissauGuyanaHaitiHeavily indebted poor countries (HIPC)High incomeHondurasHong Kong SAR, ChinaHungaryIBRD onlyIcelandIDA & IBRD totalIDA blendIDA onlyIDA totalIndiaIndonesiaIran, Islamic Rep.IraqIrelandIsraelItalyJamaicaJapanJordanKazakhstanKenyaKiribatiKorea, Rep.KuwaitKyrgyz RepublicLao PDRLate-demographic dividendLatin America & Caribbean Latin America & Caribbean (excluding high income)Latin America & the Caribbean (IDA & IBRD countries)LatviaLeast developed countries: UN classificationLebanonLesothoLiberiaLibyaLithuaniaLow & middle incomeLower middle incomeLuxembourgMacao SAR, ChinaMacedonia, FYRMadagascarMalawiMalaysiaMaldivesMaliMaltaMauritaniaMauritiusMexicoMiddle East & North AfricaMiddle East & North Africa (excluding high income)Middle East & North Africa (IDA & IBRD countries)Middle incomeMoldovaMongoliaMoroccoMozambiqueMyanmarNamibiaNepalNetherlandsNew CaledoniaNew ZealandNicaraguaNigerNigeriaNorth AmericaNorwayOECD membersOmanOther small statesPacific island small statesPakistanPalauPanamaPapua New GuineaParaguayPeruPhilippinesPolandPortugalPost-demographic dividendPre-demographic dividendQatarRomaniaRussian FederationRwandaSamoaSao Tome and PrincipeSaudi ArabiaSenegalSerbiaSeychellesSierra LeoneSingaporeSlovak RepublicSloveniaSmall statesSolomon IslandsSomaliaSouth AfricaSouth AsiaSouth Asia (IDA & IBRD)SpainSri LankaSt. Kitts and NevisSt. LuciaSt. Vincent and the GrenadinesSub-Saharan Africa Sub-Saharan Africa (excluding high income)Sub-Saharan Africa (IDA & IBRD countries)SudanSurinameSwazilandSwedenSwitzerlandSyrian Arab RepublicTajikistanTanzaniaThailandTimor-LesteTogoTongaTrinidad and TobagoTunisiaTurkeyTurkmenistanTurks and Caicos IslandsUgandaUkraineUnited Arab EmiratesUnited KingdomUnited StatesUpper middle incomeUruguayVanuatuVenezuela, RBVietnamVirgin Islands (U.S.)WorldYemen, Rep.ZambiaZimbabwe Timeline:
This timeline shows a graph from 1963 to 2014 of Venezuela, RB. No data until 1962. Number of actual observations by date: 51.
Source name:
World Development Indicators
Source organization:
World Bank staff estimates from the Comtrade database maintained by the United Nations Statistics Division.
Categories, topics:
Energy & Mining, Private Sector, Trade
Last updated:
apr 23, 2017
Indicators value changes by year
At the date of observation
Value
Absolute change
Change from previous value
jan 1, 1963
0.181
+0.181
0.0%
jan 1, 1964
3.767
+3.586
1.98K%
jan 1, 1965
5.872
+2.105
55.88%
jan 1, 1966
4.66
-1.212
-20.64%
jan 1, 1967
4.964
+0.305
6.54%
jan 1, 1968
4.351
-0.613
-12.35%
jan 1, 1969
4.127
-0.224
-5.16%
jan 1, 1970
5.036
+0.909
22.01%
jan 1, 1971
5.808
+0.772
15.34%
jan 1, 1972
5.504
-0.304
-5.24%
jan 1, 1973
5.033
-0.471
-8.56%
jan 1, 1974
4.355
-0.678
-13.47%
jan 1, 1975
2.873
-1.481
-34.02%
jan 1, 1976
3.359
+0.486
16.91%
jan 1, 1977
3.632
+0.272
8.11%
jan 1, 1978
4.938
+1.306
35.96%
jan 1, 1979
2.887
-2.05
-41.52%
jan 1, 1980
4.923
+2.036
70.5%
jan 1, 1981
3.885
-1.038
-21.08%
jan 1, 1982
4.31
+0.425
10.94%
jan 1, 1983
2.348
-1.962
-45.52%
jan 1, 1984
2.298
-0.05
-2.15%
jan 1, 1985
2.364
+0.067
2.9%
jan 1, 1986
6.775
+4.411
186.53%
jan 1, 1987
5.068
-1.707
-25.19%
jan 1, 1988
5.022
-0.047
-0.92%
jan 1, 1989
9.793
+4.771
95.0%
jan 1, 1990
9.323
-0.47
-4.8%
jan 1, 1991
7.182
-2.141
-22.96%
jan 1, 1992
7.406
+0.224
3.11%
jan 1, 1993
6.531
-0.875
-11.82%
jan 1, 1994
5.116
-1.415
-21.67%
jan 1, 1995
5.729
+0.613
11.98%
jan 1, 1996
6.233
+0.505
8.81%
jan 1, 1997
4.428
-1.805
-28.96%
jan 1, 1998
4.479
+0.051
1.16%
jan 1, 1999
5.652
+1.173
26.18%
jan 1, 2000
4.018
-1.634
-28.92%
jan 1, 2001
3.048
-0.969
-24.13%
jan 1, 2002
3.613
+0.565
18.54%
jan 1, 2003
4.001
+0.388
10.73%
jan 1, 2004
3.717
-0.284
-7.11%
jan 1, 2005
2.887
-0.83
-22.33%
jan 1, 2006
2.031
-0.856
-29.65%
jan 1, 2007
1.799
-0.232
-11.42%
jan 1, 2009
1.706
-0.093
-5.18%
jan 1, 2010
1.119
-0.586
-34.37%
jan 1, 2011
2.073
+0.954
85.22%
jan 1, 2012
0.878
-1.195
-57.64%
jan 1, 2013
0.046
-0.832
-94.76%
jan 1, 2014
0.436
+0.39
846.94%
Ranking of countries by current statistics by years


Comments: