29
/
en
AIzaSyAYiBZKx7MnpbEhh9jyipgxe19OcubqV5w
April 1, 2024
66441
Algeria
DZA
true
2
1
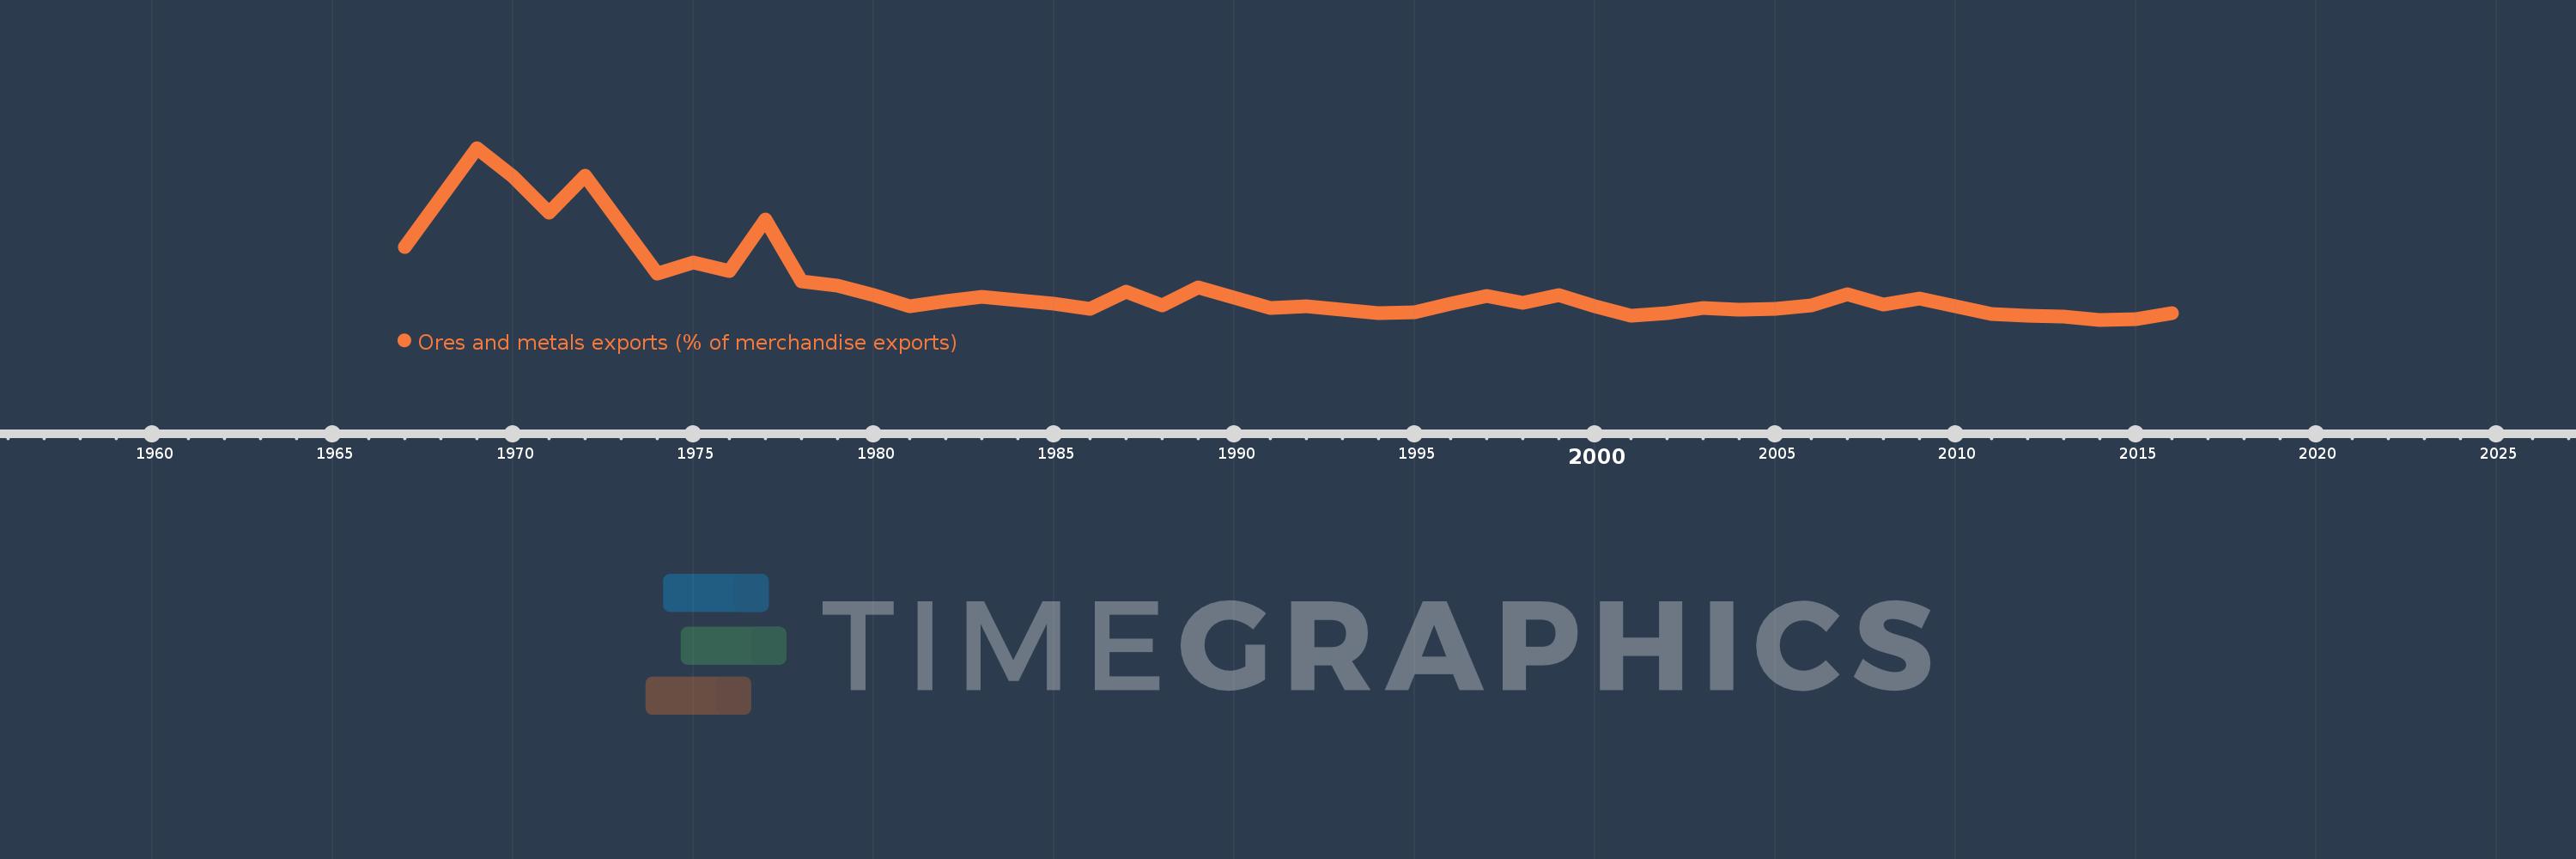
Ores and metals exports (% of merchandise exports)
2016,2015,2014,2013,2012,2011,2010,2009,2008,2007,2006,2005,2004,2003,2002,2001,2000,1999,1998,1997,1996,1995,1994,1993,1992,1991,1990,1989,1988,1987,1986,1985,1984,1983,1982,1981,1980,1979,1978,1977,1976,1975,1974,1972,1971,1970,1969,1967
This statistics in other country:
AfghanistanAlbaniaAlgeriaAndorraAngolaAntigua and BarbudaArab WorldArgentinaArmeniaArubaAustraliaAustriaAzerbaijanBahamas, TheBahrainBangladeshBarbadosBelarusBelgiumBelizeBeninBermudaBhutanBoliviaBosnia and HerzegovinaBotswanaBrazilBrunei DarussalamBulgariaBurkina FasoBurundiCabo VerdeCambodiaCameroonCanadaCaribbean small statesCayman IslandsCentral African RepublicCentral Europe and the BalticsChadChileChinaColombiaComorosCongo, Dem. Rep.Congo, Rep.Costa RicaCote d'IvoireCroatiaCubaCyprusCzech RepublicDenmarkDjiboutiDominicaDominican RepublicEarly-demographic dividendEast Asia & PacificEast Asia & Pacific (excluding high income)East Asia & Pacific (IDA & IBRD countries)EcuadorEgypt, Arab Rep.El SalvadorEquatorial GuineaEritreaEstoniaEthiopiaEuro areaEurope & Central AsiaEurope & Central Asia (excluding high income)Europe & Central Asia (IDA & IBRD countries)European UnionFaroe IslandsFijiFinlandFragile and conflict affected situationsFranceFrench PolynesiaGabonGambia, TheGeorgiaGermanyGhanaGreeceGreenlandGrenadaGuatemalaGuineaGuinea-BissauGuyanaHaitiHeavily indebted poor countries (HIPC)High incomeHondurasHong Kong SAR, ChinaHungaryIBRD onlyIcelandIDA & IBRD totalIDA blendIDA onlyIDA totalIndiaIndonesiaIran, Islamic Rep.IraqIrelandIsraelItalyJamaicaJapanJordanKazakhstanKenyaKiribatiKorea, Rep.KuwaitKyrgyz RepublicLao PDRLate-demographic dividendLatin America & Caribbean Latin America & Caribbean (excluding high income)Latin America & the Caribbean (IDA & IBRD countries)LatviaLeast developed countries: UN classificationLebanonLesothoLiberiaLibyaLithuaniaLow & middle incomeLower middle incomeLuxembourgMacao SAR, ChinaMacedonia, FYRMadagascarMalawiMalaysiaMaldivesMaliMaltaMauritaniaMauritiusMexicoMiddle East & North AfricaMiddle East & North Africa (excluding high income)Middle East & North Africa (IDA & IBRD countries)Middle incomeMoldovaMongoliaMoroccoMozambiqueMyanmarNamibiaNepalNetherlandsNew CaledoniaNew ZealandNicaraguaNigerNigeriaNorth AmericaNorwayOECD membersOmanOther small statesPacific island small statesPakistanPalauPanamaPapua New GuineaParaguayPeruPhilippinesPolandPortugalPost-demographic dividendPre-demographic dividendQatarRomaniaRussian FederationRwandaSamoaSao Tome and PrincipeSaudi ArabiaSenegalSerbiaSeychellesSierra LeoneSingaporeSlovak RepublicSloveniaSmall statesSolomon IslandsSomaliaSouth AfricaSouth AsiaSouth Asia (IDA & IBRD)SpainSri LankaSt. Kitts and NevisSt. LuciaSt. Vincent and the GrenadinesSub-Saharan Africa Sub-Saharan Africa (excluding high income)Sub-Saharan Africa (IDA & IBRD countries)SudanSurinameSwazilandSwedenSwitzerlandSyrian Arab RepublicTajikistanTanzaniaThailandTimor-LesteTogoTongaTrinidad and TobagoTunisiaTurkeyTurkmenistanTurks and Caicos IslandsUgandaUkraineUnited Arab EmiratesUnited KingdomUnited StatesUpper middle incomeUruguayVanuatuVenezuela, RBVietnamVirgin Islands (U.S.)WorldYemen, Rep.ZambiaZimbabwe Timeline:
This timeline shows a graph from 1967 to 2016 of Algeria. No data until 1966. Number of actual observations by date: 48.
Source name:
World Development Indicators
Source organization:
World Bank staff estimates from the Comtrade database maintained by the United Nations Statistics Division.
Categories, topics:
Energy & Mining, Private Sector, Trade
Last updated:
apr 23, 2017
Indicators value changes by year
At the date of observation
Value
Absolute change
Change from previous value
jan 1, 1967
1.767
+1.767
0.0%
jan 1, 1969
3.943
+2.176
123.11%
jan 1, 1970
3.314
-0.628
-15.93%
jan 1, 1971
2.529
-0.785
-23.7%
jan 1, 1972
3.337
+0.808
31.94%
jan 1, 1974
1.177
-2.16
-64.73%
jan 1, 1975
1.427
+0.25
21.26%
jan 1, 1976
1.236
-0.191
-13.39%
jan 1, 1977
2.374
+1.138
92.09%
jan 1, 1978
1.009
-1.366
-57.52%
jan 1, 1979
0.911
-0.098
-9.67%
jan 1, 1980
0.703
-0.208
-22.8%
jan 1, 1981
0.464
-0.239
-34.05%
jan 1, 1982
0.58
+0.116
25.06%
jan 1, 1983
0.664
+0.084
14.43%
jan 1, 1984
0.602
-0.062
-9.33%
jan 1, 1985
0.512
-0.09
-14.88%
jan 1, 1986
0.399
-0.113
-22.03%
jan 1, 1987
0.777
+0.378
94.59%
jan 1, 1988
0.49
-0.287
-36.91%
jan 1, 1989
0.88
+0.389
79.38%
jan 1, 1990
0.644
-0.236
-26.82%
jan 1, 1991
0.429
-0.215
-33.39%
jan 1, 1992
0.471
+0.042
9.82%
jan 1, 1993
0.382
-0.089
-18.94%
jan 1, 1994
0.31
-0.071
-18.7%
jan 1, 1995
0.327
+0.017
5.36%
jan 1, 1996
0.515
+0.188
57.61%
jan 1, 1997
0.681
+0.166
32.13%
jan 1, 1998
0.533
-0.148
-21.67%
jan 1, 1999
0.706
+0.173
32.37%
jan 1, 2000
0.467
-0.24
-33.94%
jan 1, 2001
0.253
-0.214
-45.81%
jan 1, 2002
0.314
+0.061
24.05%
jan 1, 2003
0.426
+0.113
35.98%
jan 1, 2004
0.381
-0.046
-10.69%
jan 1, 2005
0.415
+0.034
8.93%
jan 1, 2006
0.491
+0.076
18.4%
jan 1, 2007
0.722
+0.231
46.94%
jan 1, 2008
0.509
-0.213
-29.53%
jan 1, 2009
0.633
+0.124
24.45%
jan 1, 2010
0.471
-0.162
-25.62%
jan 1, 2011
0.291
-0.179
-38.13%
jan 1, 2012
0.256
-0.035
-12.12%
jan 1, 2013
0.246
-0.01
-3.86%
jan 1, 2014
0.167
-0.079
-32.13%
jan 1, 2015
0.18
+0.013
7.59%
jan 1, 2016
0.309
+0.129
72.01%
Ranking of countries by current statistics by years


Comments: