29
/
en
AIzaSyAYiBZKx7MnpbEhh9jyipgxe19OcubqV5w
April 1, 2024
119243
Denmark
DNK
true
2
1
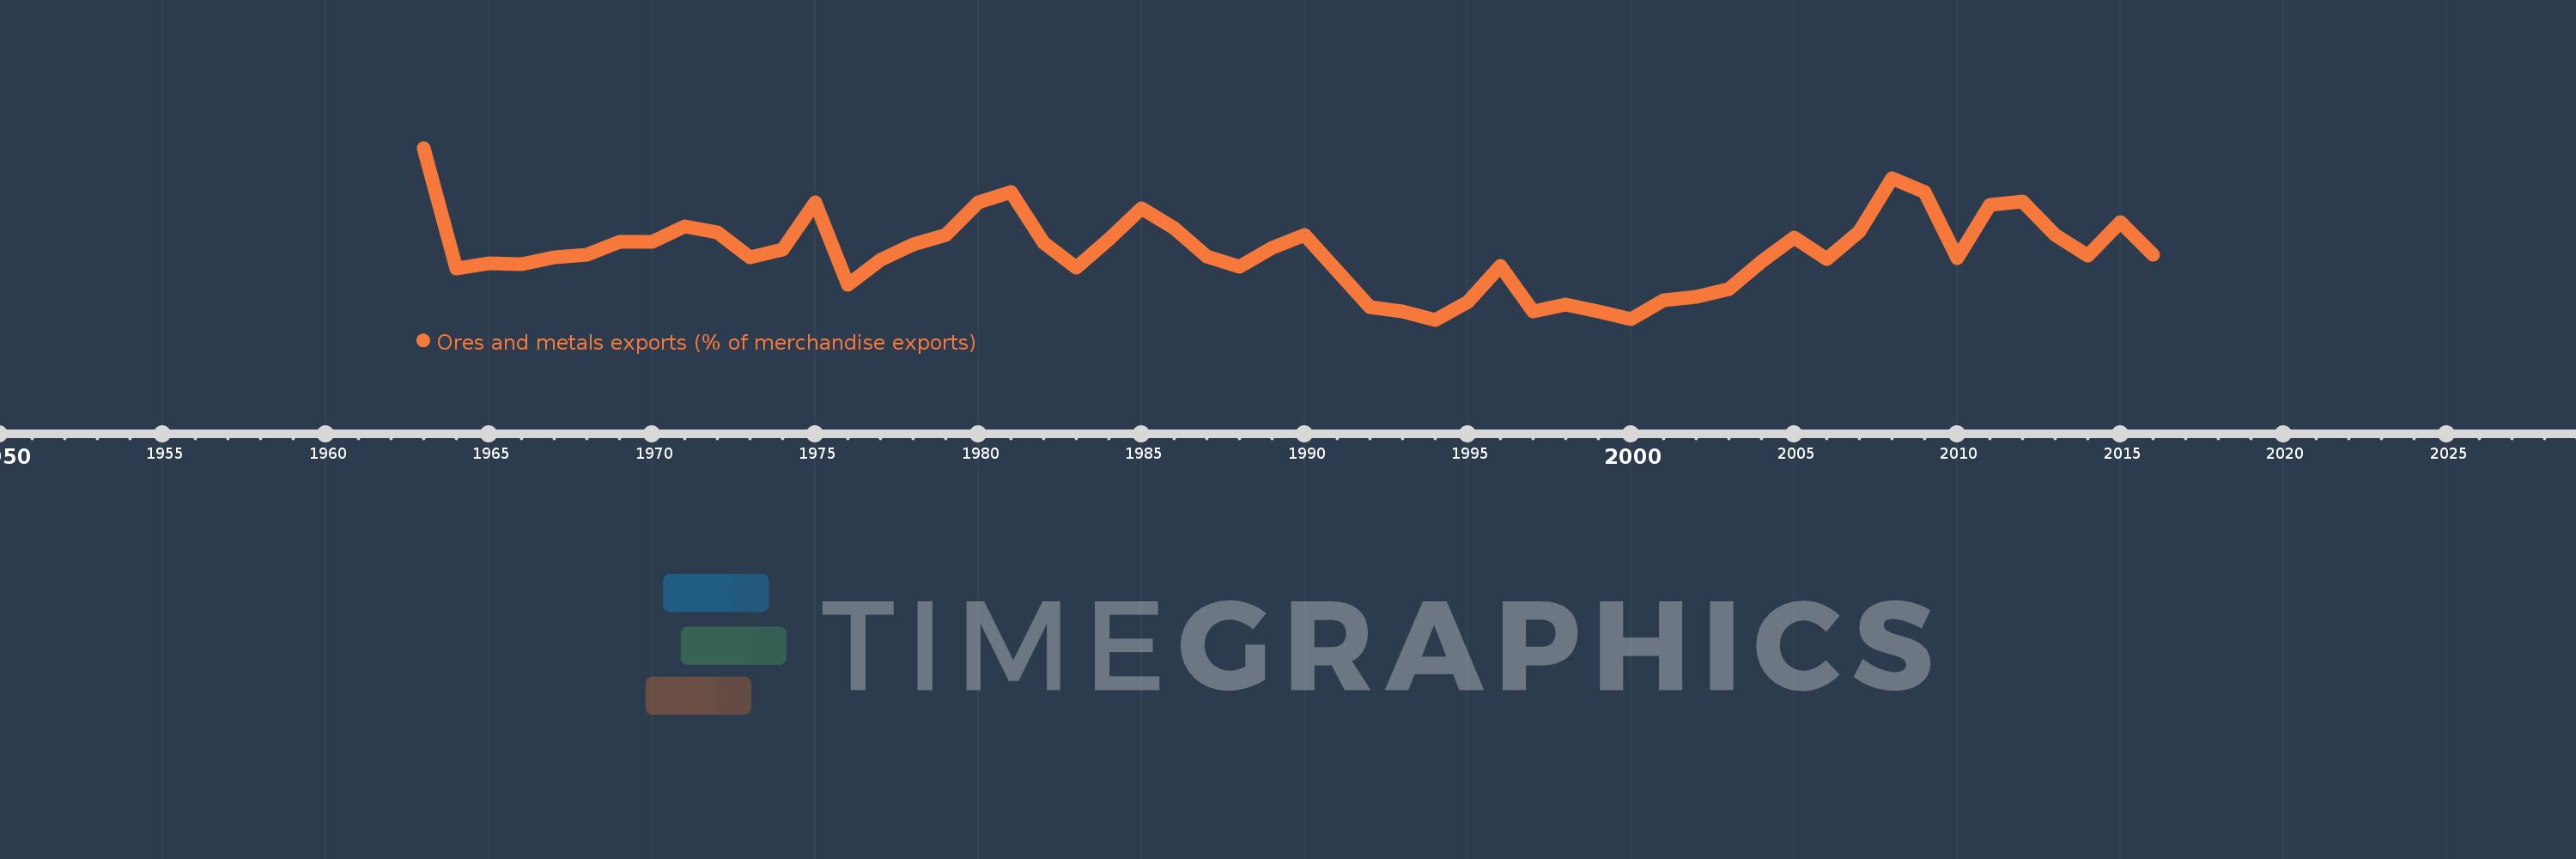
Ores and metals exports (% of merchandise exports)
2016,2015,2014,2013,2012,2011,2010,2009,2008,2007,2006,2005,2004,2003,2002,2001,2000,1999,1998,1997,1996,1995,1994,1993,1992,1991,1990,1989,1988,1987,1986,1985,1984,1983,1982,1981,1980,1979,1978,1977,1976,1975,1974,1973,1972,1971,1970,1969,1968,1967,1966,1965,1964,1963
This statistics in other country:
AfghanistanAlbaniaAlgeriaAndorraAngolaAntigua and BarbudaArab WorldArgentinaArmeniaArubaAustraliaAustriaAzerbaijanBahamas, TheBahrainBangladeshBarbadosBelarusBelgiumBelizeBeninBermudaBhutanBoliviaBosnia and HerzegovinaBotswanaBrazilBrunei DarussalamBulgariaBurkina FasoBurundiCabo VerdeCambodiaCameroonCanadaCaribbean small statesCayman IslandsCentral African RepublicCentral Europe and the BalticsChadChileChinaColombiaComorosCongo, Dem. Rep.Congo, Rep.Costa RicaCote d'IvoireCroatiaCubaCyprusCzech RepublicDenmarkDjiboutiDominicaDominican RepublicEarly-demographic dividendEast Asia & PacificEast Asia & Pacific (excluding high income)East Asia & Pacific (IDA & IBRD countries)EcuadorEgypt, Arab Rep.El SalvadorEquatorial GuineaEritreaEstoniaEthiopiaEuro areaEurope & Central AsiaEurope & Central Asia (excluding high income)Europe & Central Asia (IDA & IBRD countries)European UnionFaroe IslandsFijiFinlandFragile and conflict affected situationsFranceFrench PolynesiaGabonGambia, TheGeorgiaGermanyGhanaGreeceGreenlandGrenadaGuatemalaGuineaGuinea-BissauGuyanaHaitiHeavily indebted poor countries (HIPC)High incomeHondurasHong Kong SAR, ChinaHungaryIBRD onlyIcelandIDA & IBRD totalIDA blendIDA onlyIDA totalIndiaIndonesiaIran, Islamic Rep.IraqIrelandIsraelItalyJamaicaJapanJordanKazakhstanKenyaKiribatiKorea, Rep.KuwaitKyrgyz RepublicLao PDRLate-demographic dividendLatin America & Caribbean Latin America & Caribbean (excluding high income)Latin America & the Caribbean (IDA & IBRD countries)LatviaLeast developed countries: UN classificationLebanonLesothoLiberiaLibyaLithuaniaLow & middle incomeLower middle incomeLuxembourgMacao SAR, ChinaMacedonia, FYRMadagascarMalawiMalaysiaMaldivesMaliMaltaMauritaniaMauritiusMexicoMiddle East & North AfricaMiddle East & North Africa (excluding high income)Middle East & North Africa (IDA & IBRD countries)Middle incomeMoldovaMongoliaMoroccoMozambiqueMyanmarNamibiaNepalNetherlandsNew CaledoniaNew ZealandNicaraguaNigerNigeriaNorth AmericaNorwayOECD membersOmanOther small statesPacific island small statesPakistanPalauPanamaPapua New GuineaParaguayPeruPhilippinesPolandPortugalPost-demographic dividendPre-demographic dividendQatarRomaniaRussian FederationRwandaSamoaSao Tome and PrincipeSaudi ArabiaSenegalSerbiaSeychellesSierra LeoneSingaporeSlovak RepublicSloveniaSmall statesSolomon IslandsSomaliaSouth AfricaSouth AsiaSouth Asia (IDA & IBRD)SpainSri LankaSt. Kitts and NevisSt. LuciaSt. Vincent and the GrenadinesSub-Saharan Africa Sub-Saharan Africa (excluding high income)Sub-Saharan Africa (IDA & IBRD countries)SudanSurinameSwazilandSwedenSwitzerlandSyrian Arab RepublicTajikistanTanzaniaThailandTimor-LesteTogoTongaTrinidad and TobagoTunisiaTurkeyTurkmenistanTurks and Caicos IslandsUgandaUkraineUnited Arab EmiratesUnited KingdomUnited StatesUpper middle incomeUruguayVanuatuVenezuela, RBVietnamVirgin Islands (U.S.)WorldYemen, Rep.ZambiaZimbabwe Timeline:
This timeline shows a graph from 1963 to 2016 of Denmark. No data until 1962. Number of actual observations by date: 54.
Source name:
World Development Indicators
Source organization:
World Bank staff estimates from the Comtrade database maintained by the United Nations Statistics Division.
Categories, topics:
Energy & Mining, Private Sector, Trade
Last updated:
apr 23, 2017
Indicators value changes by year
At the date of observation
Value
Absolute change
Change from previous value
jan 1, 1963
1.997
+1.997
0.0%
jan 1, 1964
1.22
-0.778
-38.94%
jan 1, 1965
1.254
+0.035
2.85%
jan 1, 1966
1.251
-0.003
-0.24%
jan 1, 1967
1.295
+0.044
3.5%
jan 1, 1968
1.312
+0.017
1.33%
jan 1, 1969
1.391
+0.079
6.0%
jan 1, 1970
1.391
+0.0
0.03%
jan 1, 1971
1.492
+0.101
7.26%
jan 1, 1972
1.452
-0.04
-2.69%
jan 1, 1973
1.295
-0.157
-10.84%
jan 1, 1974
1.346
+0.051
3.96%
jan 1, 1975
1.645
+0.299
22.19%
jan 1, 1976
1.115
-0.53
-32.2%
jan 1, 1977
1.275
+0.16
14.35%
jan 1, 1978
1.374
+0.099
7.74%
jan 1, 1979
1.436
+0.062
4.54%
jan 1, 1980
1.648
+0.212
14.77%
jan 1, 1981
1.716
+0.068
4.11%
jan 1, 1982
1.387
-0.329
-19.15%
jan 1, 1983
1.225
-0.163
-11.73%
jan 1, 1984
1.408
+0.184
15.0%
jan 1, 1985
1.607
+0.198
14.09%
jan 1, 1986
1.481
-0.126
-7.84%
jan 1, 1987
1.3
-0.181
-12.2%
jan 1, 1988
1.231
-0.069
-5.3%
jan 1, 1989
1.355
+0.123
10.01%
jan 1, 1990
1.435
+0.081
5.96%
jan 1, 1991
1.204
-0.231
-16.1%
jan 1, 1992
0.973
-0.232
-19.24%
jan 1, 1993
0.948
-0.025
-2.53%
jan 1, 1994
0.892
-0.056
-5.95%
jan 1, 1995
1.004
+0.113
12.65%
jan 1, 1996
1.237
+0.232
23.14%
jan 1, 1997
0.948
-0.289
-23.38%
jan 1, 1998
0.988
+0.04
4.25%
jan 1, 1999
0.944
-0.044
-4.43%
jan 1, 2000
0.896
-0.048
-5.09%
jan 1, 2001
1.02
+0.124
13.86%
jan 1, 2002
1.04
+0.02
1.93%
jan 1, 2003
1.09
+0.051
4.86%
jan 1, 2004
1.268
+0.177
16.26%
jan 1, 2005
1.419
+0.152
11.97%
jan 1, 2006
1.284
-0.135
-9.53%
jan 1, 2007
1.461
+0.177
13.76%
jan 1, 2008
1.801
+0.34
23.3%
jan 1, 2009
1.711
-0.09
-5.01%
jan 1, 2010
1.288
-0.423
-24.74%
jan 1, 2011
1.629
+0.341
26.47%
jan 1, 2012
1.654
+0.026
1.57%
jan 1, 2013
1.439
-0.215
-13.01%
jan 1, 2014
1.305
-0.134
-9.33%
jan 1, 2015
1.519
+0.214
16.44%
jan 1, 2016
1.308
-0.211
-13.88%
Ranking of countries by current statistics by years


Comments: