29
/
en
AIzaSyAYiBZKx7MnpbEhh9jyipgxe19OcubqV5w
April 1, 2024
25192
Caribbean small states
CSS
false
2
1
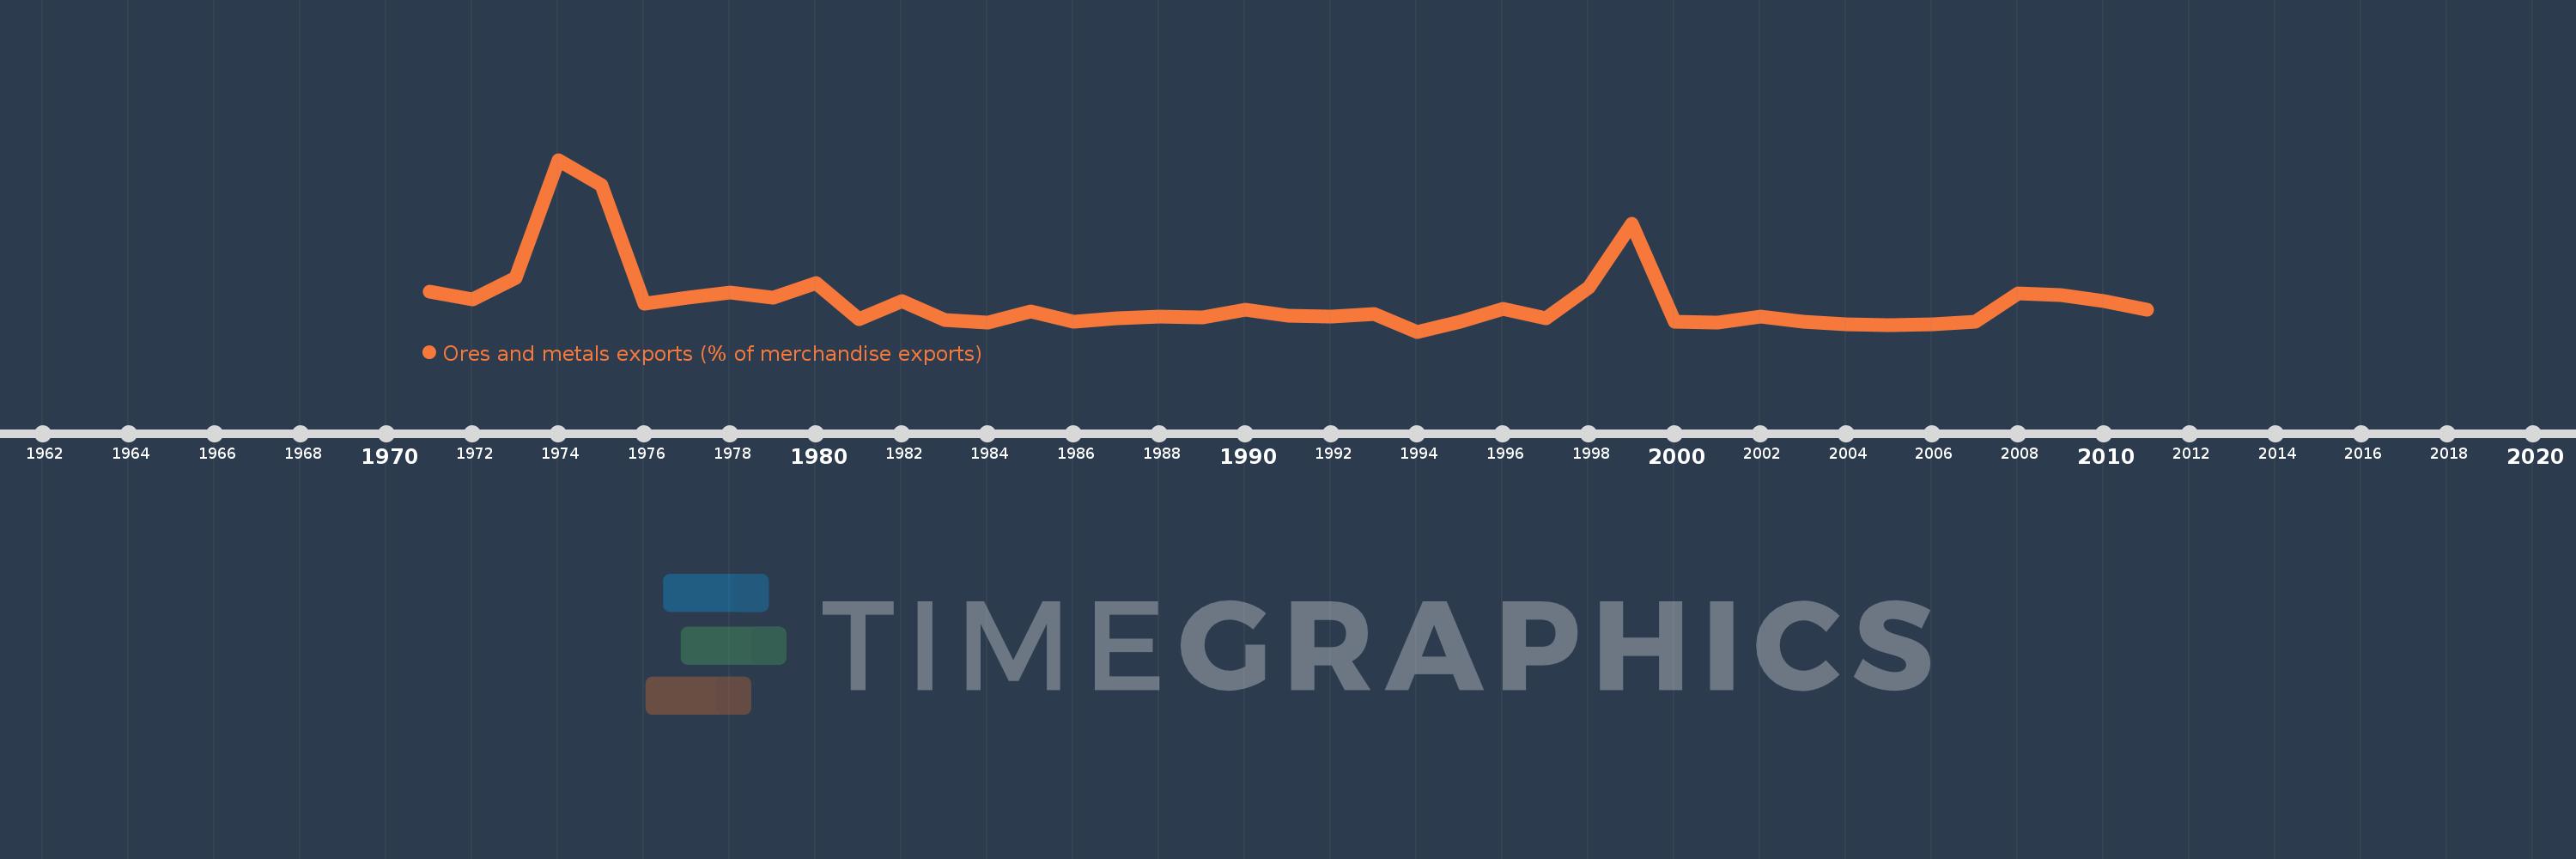
Ores and metals exports (% of merchandise exports)
2011,2010,2009,2008,2007,2006,2005,2004,2003,2002,2001,2000,1999,1998,1997,1996,1995,1994,1993,1992,1991,1990,1989,1988,1987,1986,1985,1984,1983,1982,1981,1980,1979,1978,1977,1976,1975,1974,1973,1972,1971
This statistics in other country:
AfghanistanAlbaniaAlgeriaAndorraAngolaAntigua and BarbudaArab WorldArgentinaArmeniaArubaAustraliaAustriaAzerbaijanBahamas, TheBahrainBangladeshBarbadosBelarusBelgiumBelizeBeninBermudaBhutanBoliviaBosnia and HerzegovinaBotswanaBrazilBrunei DarussalamBulgariaBurkina FasoBurundiCabo VerdeCambodiaCameroonCanadaCaribbean small statesCayman IslandsCentral African RepublicCentral Europe and the BalticsChadChileChinaColombiaComorosCongo, Dem. Rep.Congo, Rep.Costa RicaCote d'IvoireCroatiaCubaCyprusCzech RepublicDenmarkDjiboutiDominicaDominican RepublicEarly-demographic dividendEast Asia & PacificEast Asia & Pacific (excluding high income)East Asia & Pacific (IDA & IBRD countries)EcuadorEgypt, Arab Rep.El SalvadorEquatorial GuineaEritreaEstoniaEthiopiaEuro areaEurope & Central AsiaEurope & Central Asia (excluding high income)Europe & Central Asia (IDA & IBRD countries)European UnionFaroe IslandsFijiFinlandFragile and conflict affected situationsFranceFrench PolynesiaGabonGambia, TheGeorgiaGermanyGhanaGreeceGreenlandGrenadaGuatemalaGuineaGuinea-BissauGuyanaHaitiHeavily indebted poor countries (HIPC)High incomeHondurasHong Kong SAR, ChinaHungaryIBRD onlyIcelandIDA & IBRD totalIDA blendIDA onlyIDA totalIndiaIndonesiaIran, Islamic Rep.IraqIrelandIsraelItalyJamaicaJapanJordanKazakhstanKenyaKiribatiKorea, Rep.KuwaitKyrgyz RepublicLao PDRLate-demographic dividendLatin America & Caribbean Latin America & Caribbean (excluding high income)Latin America & the Caribbean (IDA & IBRD countries)LatviaLeast developed countries: UN classificationLebanonLesothoLiberiaLibyaLithuaniaLow & middle incomeLower middle incomeLuxembourgMacao SAR, ChinaMacedonia, FYRMadagascarMalawiMalaysiaMaldivesMaliMaltaMauritaniaMauritiusMexicoMiddle East & North AfricaMiddle East & North Africa (excluding high income)Middle East & North Africa (IDA & IBRD countries)Middle incomeMoldovaMongoliaMoroccoMozambiqueMyanmarNamibiaNepalNetherlandsNew CaledoniaNew ZealandNicaraguaNigerNigeriaNorth AmericaNorwayOECD membersOmanOther small statesPacific island small statesPakistanPalauPanamaPapua New GuineaParaguayPeruPhilippinesPolandPortugalPost-demographic dividendPre-demographic dividendQatarRomaniaRussian FederationRwandaSamoaSao Tome and PrincipeSaudi ArabiaSenegalSerbiaSeychellesSierra LeoneSingaporeSlovak RepublicSloveniaSmall statesSolomon IslandsSomaliaSouth AfricaSouth AsiaSouth Asia (IDA & IBRD)SpainSri LankaSt. Kitts and NevisSt. LuciaSt. Vincent and the GrenadinesSub-Saharan Africa Sub-Saharan Africa (excluding high income)Sub-Saharan Africa (IDA & IBRD countries)SudanSurinameSwazilandSwedenSwitzerlandSyrian Arab RepublicTajikistanTanzaniaThailandTimor-LesteTogoTongaTrinidad and TobagoTunisiaTurkeyTurkmenistanTurks and Caicos IslandsUgandaUkraineUnited Arab EmiratesUnited KingdomUnited StatesUpper middle incomeUruguayVanuatuVenezuela, RBVietnamVirgin Islands (U.S.)WorldYemen, Rep.ZambiaZimbabwe Timeline:
This timeline shows a graph from 1971 to 2011 of Caribbean small states. No data until 1970. Number of actual observations by date: 41.
Source name:
World Development Indicators
Source organization:
World Bank staff estimates from the Comtrade database maintained by the United Nations Statistics Division.
Categories, topics:
Energy & Mining, Private Sector, Trade
Last updated:
apr 23, 2017
Indicators value changes by year
Maximum:
16.151
jan 1, 1974
At the date of observation
Value
Absolute change
Change from previous value
jan 1, 1971
4.451
+4.451
0.0%
jan 1, 1972
3.824
-0.626
-14.08%
jan 1, 1973
5.678
+1.854
48.48%
jan 1, 1974
16.151
+10.473
184.43%
jan 1, 1975
13.928
-2.223
-13.77%
jan 1, 1976
3.442
-10.485
-75.28%
jan 1, 1977
3.98
+0.537
15.61%
jan 1, 1978
4.376
+0.397
9.97%
jan 1, 1979
3.977
-0.4
-9.13%
jan 1, 1980
5.264
+1.287
32.37%
jan 1, 1981
2.064
-3.199
-60.78%
jan 1, 1982
3.652
+1.588
76.91%
jan 1, 1983
1.931
-1.721
-47.13%
jan 1, 1984
1.748
-0.183
-9.48%
jan 1, 1985
2.705
+0.957
54.78%
jan 1, 1986
1.803
-0.902
-33.35%
jan 1, 1987
2.084
+0.281
15.61%
jan 1, 1988
2.283
+0.198
9.52%
jan 1, 1989
2.172
-0.11
-4.83%
jan 1, 1990
2.854
+0.681
31.36%
jan 1, 1991
2.353
-0.5
-17.53%
jan 1, 1992
2.233
-0.121
-5.14%
jan 1, 1993
2.462
+0.229
10.28%
jan 1, 1994
0.938
-1.524
-61.89%
jan 1, 1995
1.807
+0.868
92.56%
jan 1, 1996
2.985
+1.178
65.21%
jan 1, 1997
2.082
-0.903
-30.25%
jan 1, 1998
4.873
+2.791
134.06%
jan 1, 1999
10.471
+5.597
114.86%
jan 1, 2000
1.788
-8.683
-82.93%
jan 1, 2001
1.743
-0.044
-2.48%
jan 1, 2002
2.233
+0.489
28.07%
jan 1, 2003
1.787
-0.445
-19.95%
jan 1, 2004
1.606
-0.182
-10.17%
jan 1, 2005
1.538
-0.068
-4.21%
jan 1, 2006
1.603
+0.065
4.24%
jan 1, 2007
1.827
+0.223
13.94%
jan 1, 2008
4.311
+2.484
136.0%
jan 1, 2009
4.145
-0.166
-3.86%
jan 1, 2010
3.672
-0.473
-11.4%
jan 1, 2011
2.849
-0.823
-22.41%
Ranking of countries by current statistics by years


Comments: