29
/
en
AIzaSyAYiBZKx7MnpbEhh9jyipgxe19OcubqV5w
April 1, 2024
112695
Costa Rica
CRI
true
2
1
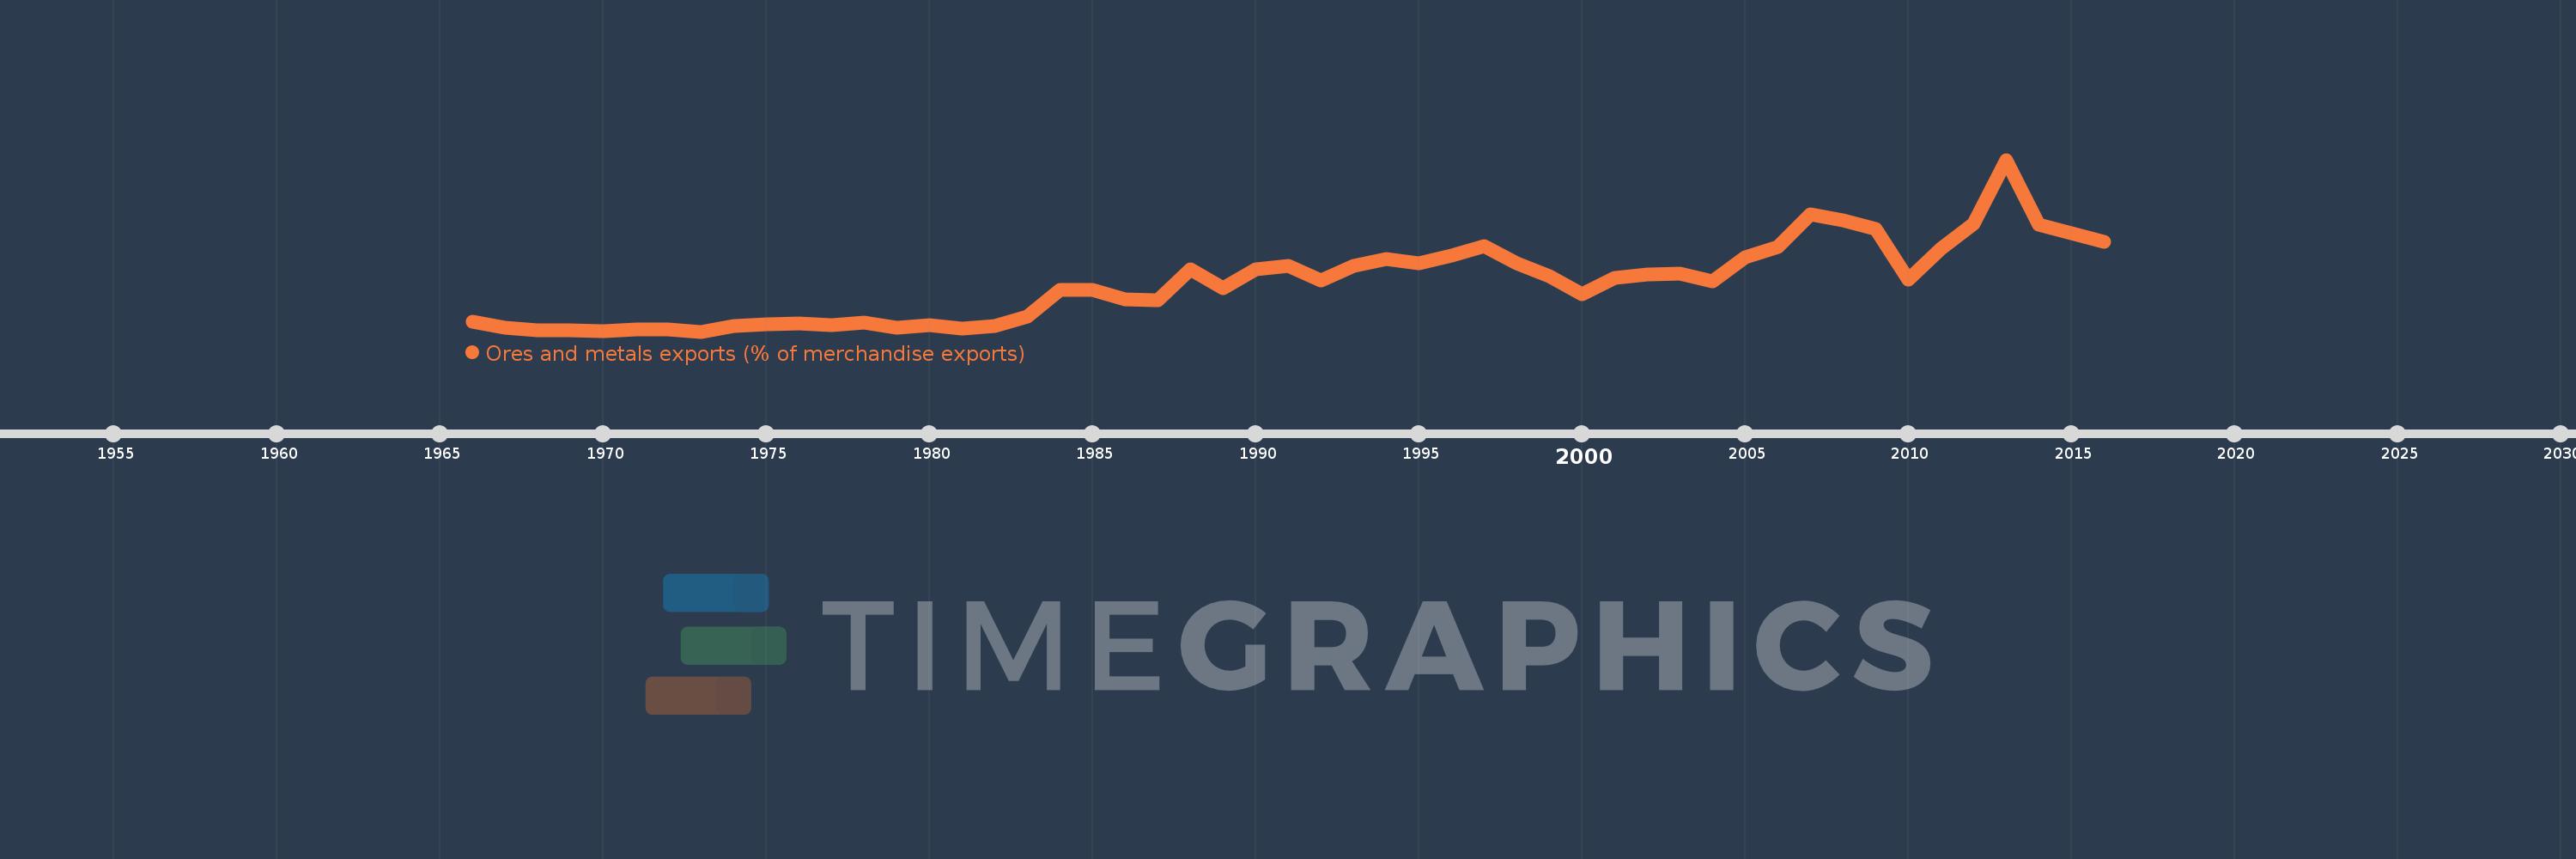
Ores and metals exports (% of merchandise exports)
2016,2014,2013,2012,2011,2010,2009,2008,2007,2006,2005,2004,2003,2002,2001,2000,1999,1998,1997,1996,1995,1994,1993,1992,1991,1990,1989,1988,1987,1986,1985,1984,1983,1982,1981,1980,1979,1978,1977,1976,1975,1974,1973,1972,1971,1970,1969,1968,1967,1966
This statistics in other country:
AfghanistanAlbaniaAlgeriaAndorraAngolaAntigua and BarbudaArab WorldArgentinaArmeniaArubaAustraliaAustriaAzerbaijanBahamas, TheBahrainBangladeshBarbadosBelarusBelgiumBelizeBeninBermudaBhutanBoliviaBosnia and HerzegovinaBotswanaBrazilBrunei DarussalamBulgariaBurkina FasoBurundiCabo VerdeCambodiaCameroonCanadaCaribbean small statesCayman IslandsCentral African RepublicCentral Europe and the BalticsChadChileChinaColombiaComorosCongo, Dem. Rep.Congo, Rep.Costa RicaCote d'IvoireCroatiaCubaCyprusCzech RepublicDenmarkDjiboutiDominicaDominican RepublicEarly-demographic dividendEast Asia & PacificEast Asia & Pacific (excluding high income)East Asia & Pacific (IDA & IBRD countries)EcuadorEgypt, Arab Rep.El SalvadorEquatorial GuineaEritreaEstoniaEthiopiaEuro areaEurope & Central AsiaEurope & Central Asia (excluding high income)Europe & Central Asia (IDA & IBRD countries)European UnionFaroe IslandsFijiFinlandFragile and conflict affected situationsFranceFrench PolynesiaGabonGambia, TheGeorgiaGermanyGhanaGreeceGreenlandGrenadaGuatemalaGuineaGuinea-BissauGuyanaHaitiHeavily indebted poor countries (HIPC)High incomeHondurasHong Kong SAR, ChinaHungaryIBRD onlyIcelandIDA & IBRD totalIDA blendIDA onlyIDA totalIndiaIndonesiaIran, Islamic Rep.IraqIrelandIsraelItalyJamaicaJapanJordanKazakhstanKenyaKiribatiKorea, Rep.KuwaitKyrgyz RepublicLao PDRLate-demographic dividendLatin America & Caribbean Latin America & Caribbean (excluding high income)Latin America & the Caribbean (IDA & IBRD countries)LatviaLeast developed countries: UN classificationLebanonLesothoLiberiaLibyaLithuaniaLow & middle incomeLower middle incomeLuxembourgMacao SAR, ChinaMacedonia, FYRMadagascarMalawiMalaysiaMaldivesMaliMaltaMauritaniaMauritiusMexicoMiddle East & North AfricaMiddle East & North Africa (excluding high income)Middle East & North Africa (IDA & IBRD countries)Middle incomeMoldovaMongoliaMoroccoMozambiqueMyanmarNamibiaNepalNetherlandsNew CaledoniaNew ZealandNicaraguaNigerNigeriaNorth AmericaNorwayOECD membersOmanOther small statesPacific island small statesPakistanPalauPanamaPapua New GuineaParaguayPeruPhilippinesPolandPortugalPost-demographic dividendPre-demographic dividendQatarRomaniaRussian FederationRwandaSamoaSao Tome and PrincipeSaudi ArabiaSenegalSerbiaSeychellesSierra LeoneSingaporeSlovak RepublicSloveniaSmall statesSolomon IslandsSomaliaSouth AfricaSouth AsiaSouth Asia (IDA & IBRD)SpainSri LankaSt. Kitts and NevisSt. LuciaSt. Vincent and the GrenadinesSub-Saharan Africa Sub-Saharan Africa (excluding high income)Sub-Saharan Africa (IDA & IBRD countries)SudanSurinameSwazilandSwedenSwitzerlandSyrian Arab RepublicTajikistanTanzaniaThailandTimor-LesteTogoTongaTrinidad and TobagoTunisiaTurkeyTurkmenistanTurks and Caicos IslandsUgandaUkraineUnited Arab EmiratesUnited KingdomUnited StatesUpper middle incomeUruguayVanuatuVenezuela, RBVietnamVirgin Islands (U.S.)WorldYemen, Rep.ZambiaZimbabwe Timeline:
This timeline shows a graph from 1966 to 2016 of Costa Rica. No data until 1965. Number of actual observations by date: 50.
Source name:
World Development Indicators
Source organization:
World Bank staff estimates from the Comtrade database maintained by the United Nations Statistics Division.
Categories, topics:
Energy & Mining, Private Sector, Trade
Last updated:
apr 23, 2017
Indicators value changes by year
At the date of observation
Value
Absolute change
Change from previous value
jan 1, 1966
0.172
+0.172
0.0%
jan 1, 1967
0.086
-0.086
-50.17%
jan 1, 1968
0.056
-0.03
-34.85%
jan 1, 1969
0.053
-0.003
-5.22%
jan 1, 1970
0.042
-0.011
-21.14%
jan 1, 1971
0.062
+0.02
48.52%
jan 1, 1972
0.067
+0.005
8.33%
jan 1, 1973
0.035
-0.032
-47.67%
jan 1, 1974
0.115
+0.079
225.35%
jan 1, 1975
0.131
+0.016
14.37%
jan 1, 1976
0.141
+0.01
7.29%
jan 1, 1977
0.116
-0.025
-17.82%
jan 1, 1978
0.152
+0.036
31.23%
jan 1, 1979
0.091
-0.06
-39.75%
jan 1, 1980
0.122
+0.031
33.77%
jan 1, 1981
0.076
-0.046
-37.86%
jan 1, 1982
0.113
+0.037
48.42%
jan 1, 1983
0.236
+0.124
109.71%
jan 1, 1984
0.599
+0.362
153.27%
jan 1, 1985
0.6
+0.001
0.2%
jan 1, 1986
0.474
-0.126
-21.05%
jan 1, 1987
0.452
-0.022
-4.57%
jan 1, 1988
0.875
+0.423
93.62%
jan 1, 1989
0.619
-0.256
-29.22%
jan 1, 1990
0.867
+0.248
39.98%
jan 1, 1991
0.917
+0.05
5.82%
jan 1, 1992
0.728
-0.19
-20.69%
jan 1, 1993
0.92
+0.192
26.45%
jan 1, 1994
1.01
+0.09
9.74%
jan 1, 1995
0.951
-0.059
-5.84%
jan 1, 1996
1.062
+0.111
11.69%
jan 1, 1997
1.187
+0.126
11.83%
jan 1, 1998
0.951
-0.236
-19.87%
jan 1, 1999
0.786
-0.166
-17.41%
jan 1, 2000
0.537
-0.249
-31.66%
jan 1, 2001
0.761
+0.224
41.7%
jan 1, 2002
0.809
+0.048
6.32%
jan 1, 2003
0.816
+0.007
0.85%
jan 1, 2004
0.713
-0.103
-12.66%
jan 1, 2005
1.034
+0.322
45.14%
jan 1, 2006
1.172
+0.138
13.35%
jan 1, 2007
1.614
+0.441
37.65%
jan 1, 2008
1.534
-0.08
-4.98%
jan 1, 2009
1.416
-0.117
-7.65%
jan 1, 2010
0.739
-0.677
-47.82%
jan 1, 2011
1.146
+0.407
55.04%
jan 1, 2012
1.483
+0.337
29.41%
jan 1, 2013
2.346
+0.863
58.18%
jan 1, 2014
1.472
-0.874
-37.25%
jan 1, 2016
1.237
-0.235
-15.99%
Ranking of countries by current statistics by years


Comments: