29
/
en
AIzaSyAYiBZKx7MnpbEhh9jyipgxe19OcubqV5w
April 1, 2024
221279
Paraguay
PRY
true
2
1
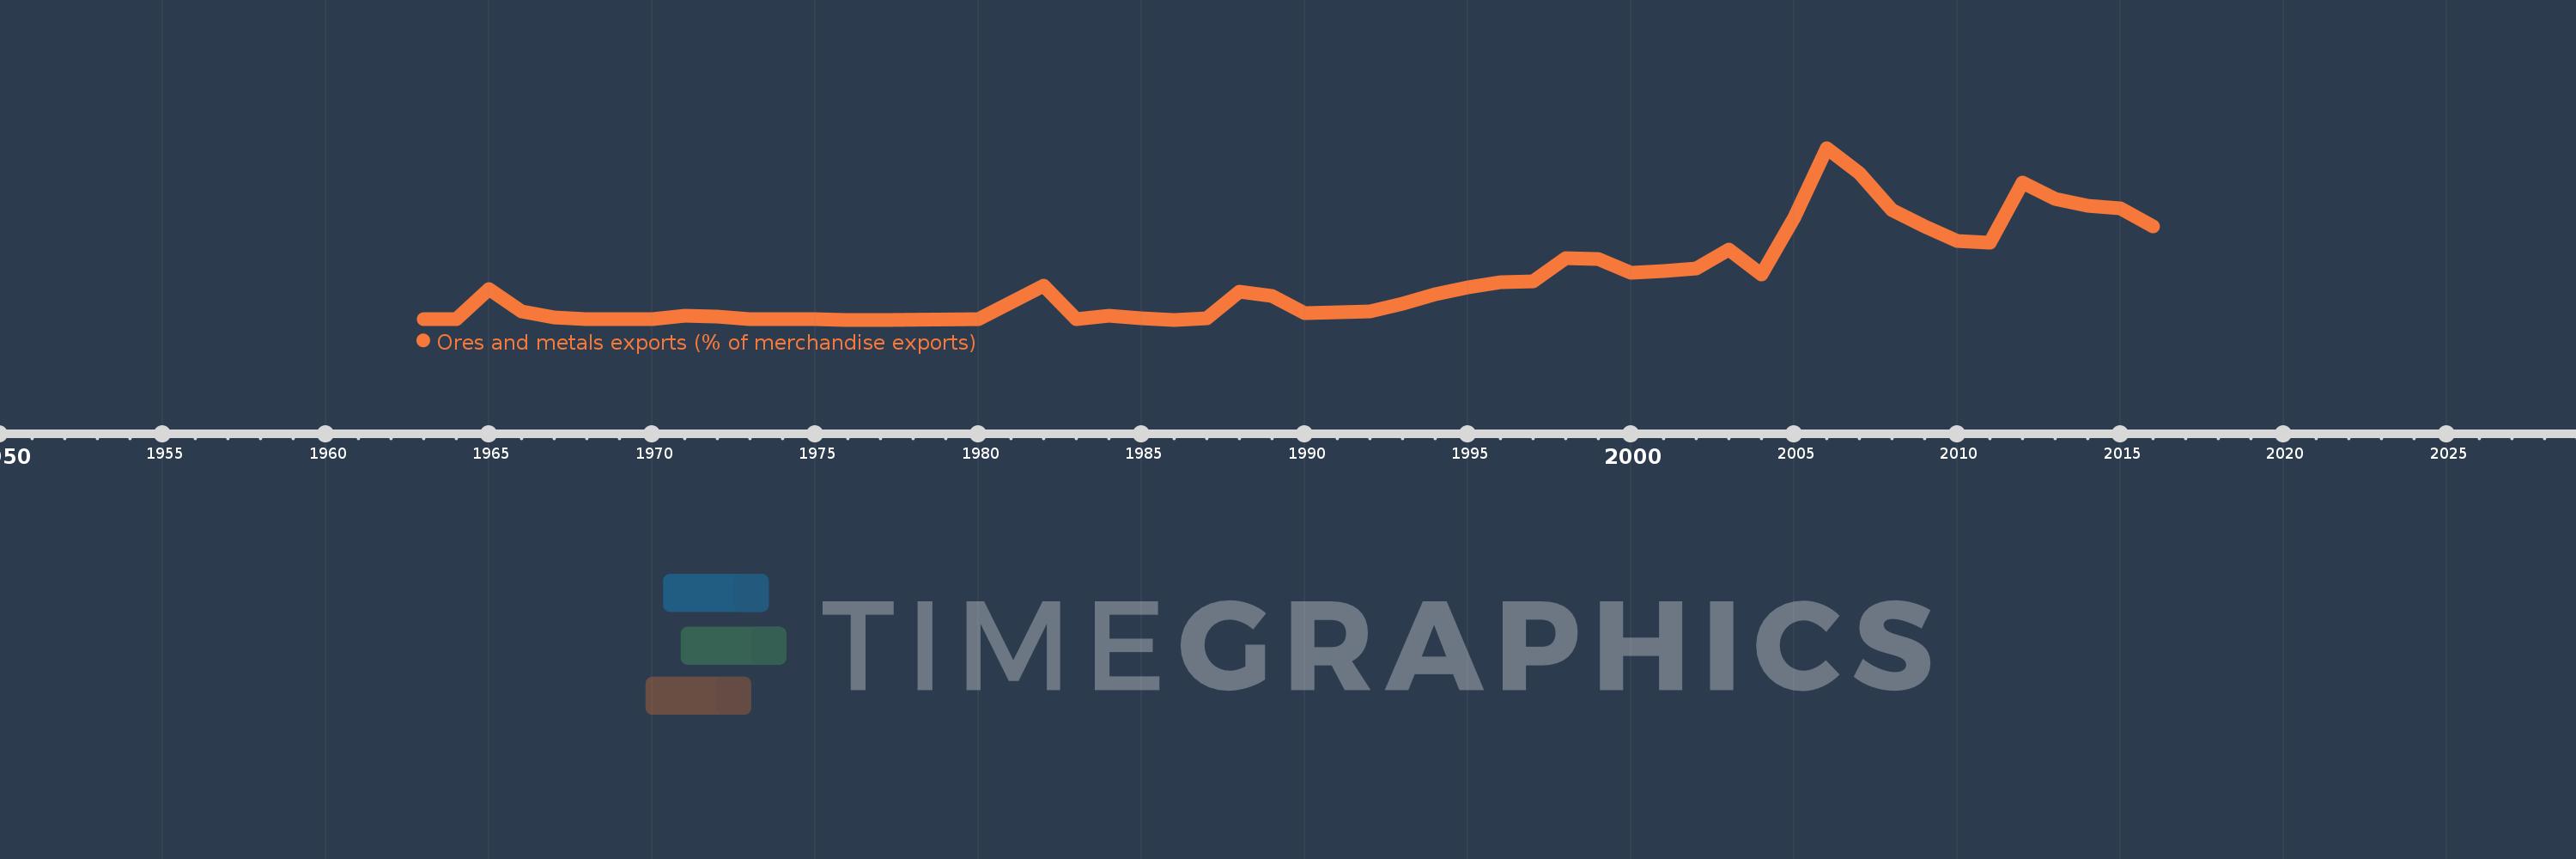
Ores and metals exports (% of merchandise exports)
2016,2015,2014,2013,2012,2011,2010,2009,2008,2007,2006,2005,2004,2003,2002,2001,2000,1999,1998,1997,1996,1995,1994,1993,1992,1991,1990,1989,1988,1987,1986,1985,1984,1983,1982,1980,1977,1976,1975,1974,1973,1972,1971,1970,1969,1968,1967,1966,1965,1964,1963
This statistics in other country:
AfghanistanAlbaniaAlgeriaAndorraAngolaAntigua and BarbudaArab WorldArgentinaArmeniaArubaAustraliaAustriaAzerbaijanBahamas, TheBahrainBangladeshBarbadosBelarusBelgiumBelizeBeninBermudaBhutanBoliviaBosnia and HerzegovinaBotswanaBrazilBrunei DarussalamBulgariaBurkina FasoBurundiCabo VerdeCambodiaCameroonCanadaCaribbean small statesCayman IslandsCentral African RepublicCentral Europe and the BalticsChadChileChinaColombiaComorosCongo, Dem. Rep.Congo, Rep.Costa RicaCote d'IvoireCroatiaCubaCyprusCzech RepublicDenmarkDjiboutiDominicaDominican RepublicEarly-demographic dividendEast Asia & PacificEast Asia & Pacific (excluding high income)East Asia & Pacific (IDA & IBRD countries)EcuadorEgypt, Arab Rep.El SalvadorEquatorial GuineaEritreaEstoniaEthiopiaEuro areaEurope & Central AsiaEurope & Central Asia (excluding high income)Europe & Central Asia (IDA & IBRD countries)European UnionFaroe IslandsFijiFinlandFragile and conflict affected situationsFranceFrench PolynesiaGabonGambia, TheGeorgiaGermanyGhanaGreeceGreenlandGrenadaGuatemalaGuineaGuinea-BissauGuyanaHaitiHeavily indebted poor countries (HIPC)High incomeHondurasHong Kong SAR, ChinaHungaryIBRD onlyIcelandIDA & IBRD totalIDA blendIDA onlyIDA totalIndiaIndonesiaIran, Islamic Rep.IraqIrelandIsraelItalyJamaicaJapanJordanKazakhstanKenyaKiribatiKorea, Rep.KuwaitKyrgyz RepublicLao PDRLate-demographic dividendLatin America & Caribbean Latin America & Caribbean (excluding high income)Latin America & the Caribbean (IDA & IBRD countries)LatviaLeast developed countries: UN classificationLebanonLesothoLiberiaLibyaLithuaniaLow & middle incomeLower middle incomeLuxembourgMacao SAR, ChinaMacedonia, FYRMadagascarMalawiMalaysiaMaldivesMaliMaltaMauritaniaMauritiusMexicoMiddle East & North AfricaMiddle East & North Africa (excluding high income)Middle East & North Africa (IDA & IBRD countries)Middle incomeMoldovaMongoliaMoroccoMozambiqueMyanmarNamibiaNepalNetherlandsNew CaledoniaNew ZealandNicaraguaNigerNigeriaNorth AmericaNorwayOECD membersOmanOther small statesPacific island small statesPakistanPalauPanamaPapua New GuineaParaguayPeruPhilippinesPolandPortugalPost-demographic dividendPre-demographic dividendQatarRomaniaRussian FederationRwandaSamoaSao Tome and PrincipeSaudi ArabiaSenegalSerbiaSeychellesSierra LeoneSingaporeSlovak RepublicSloveniaSmall statesSolomon IslandsSomaliaSouth AfricaSouth AsiaSouth Asia (IDA & IBRD)SpainSri LankaSt. Kitts and NevisSt. LuciaSt. Vincent and the GrenadinesSub-Saharan Africa Sub-Saharan Africa (excluding high income)Sub-Saharan Africa (IDA & IBRD countries)SudanSurinameSwazilandSwedenSwitzerlandSyrian Arab RepublicTajikistanTanzaniaThailandTimor-LesteTogoTongaTrinidad and TobagoTunisiaTurkeyTurkmenistanTurks and Caicos IslandsUgandaUkraineUnited Arab EmiratesUnited KingdomUnited StatesUpper middle incomeUruguayVanuatuVenezuela, RBVietnamVirgin Islands (U.S.)WorldYemen, Rep.ZambiaZimbabwe Timeline:
This timeline shows a graph from 1963 to 2016 of Paraguay. No data until 1962. Number of actual observations by date: 51.
Source name:
World Development Indicators
Source organization:
World Bank staff estimates from the Comtrade database maintained by the United Nations Statistics Division.
Categories, topics:
Energy & Mining, Private Sector, Trade
Last updated:
apr 23, 2017
Indicators value changes by year
At the date of observation
Value
Absolute change
Change from previous value
jan 1, 1963
0.004
+0.004
0.0%
jan 1, 1964
0.002
-0.002
-55.64%
jan 1, 1965
0.226
+0.224
11.25K%
jan 1, 1966
0.061
-0.165
-72.92%
jan 1, 1967
0.015
-0.047
-76.14%
jan 1, 1968
0.005
-0.009
-64.48%
jan 1, 1969
0.002
-0.003
-59.43%
jan 1, 1970
0.006
+0.004
170.73%
jan 1, 1971
0.032
+0.026
459.61%
jan 1, 1972
0.022
-0.01
-30.65%
jan 1, 1973
0.003
-0.019
-86.87%
jan 1, 1974
0.006
+0.003
114.37%
jan 1, 1975
0.006
-0.001
-11.45%
jan 1, 1976
0.001
-0.005
-84.58%
jan 1, 1977
0.0
-0.001
-97.66%
jan 1, 1980
0.003
+0.003
15.47K%
jan 1, 1982
0.251
+0.248
8.02K%
jan 1, 1983
0.002
-0.249
-99.32%
jan 1, 1984
0.029
+0.027
1.6K%
jan 1, 1985
0.009
-0.02
-69.12%
jan 1, 1986
0.001
-0.008
-88.99%
jan 1, 1987
0.013
+0.012
1.27K%
jan 1, 1988
0.205
+0.191
1.42K%
jan 1, 1989
0.172
-0.032
-15.84%
jan 1, 1990
0.047
-0.125
-72.66%
jan 1, 1991
0.053
+0.005
11.43%
jan 1, 1992
0.063
+0.011
20.51%
jan 1, 1993
0.12
+0.056
88.84%
jan 1, 1994
0.188
+0.068
57.0%
jan 1, 1995
0.239
+0.051
27.16%
jan 1, 1996
0.275
+0.036
15.08%
jan 1, 1997
0.281
+0.006
2.33%
jan 1, 1998
0.453
+0.172
61.03%
jan 1, 1999
0.444
-0.009
-2.0%
jan 1, 2000
0.345
-0.098
-22.14%
jan 1, 2001
0.359
+0.014
4.01%
jan 1, 2002
0.374
+0.015
4.08%
jan 1, 2003
0.511
+0.137
36.71%
jan 1, 2004
0.33
-0.181
-35.37%
jan 1, 2005
0.748
+0.418
126.5%
jan 1, 2006
1.258
+0.51
68.12%
jan 1, 2007
1.076
-0.182
-14.46%
jan 1, 2008
0.805
-0.271
-25.2%
jan 1, 2009
0.682
-0.123
-15.24%
jan 1, 2010
0.579
-0.103
-15.09%
jan 1, 2011
0.563
-0.016
-2.8%
jan 1, 2012
1.005
+0.442
78.49%
jan 1, 2013
0.882
-0.123
-12.23%
jan 1, 2014
0.833
-0.049
-5.59%
jan 1, 2015
0.815
-0.017
-2.08%
jan 1, 2016
0.686
-0.129
-15.85%
Ranking of countries by current statistics by years


Comments: