29
/
en
AIzaSyAYiBZKx7MnpbEhh9jyipgxe19OcubqV5w
April 1, 2024
207192
Nepal
NPL
true
2
1
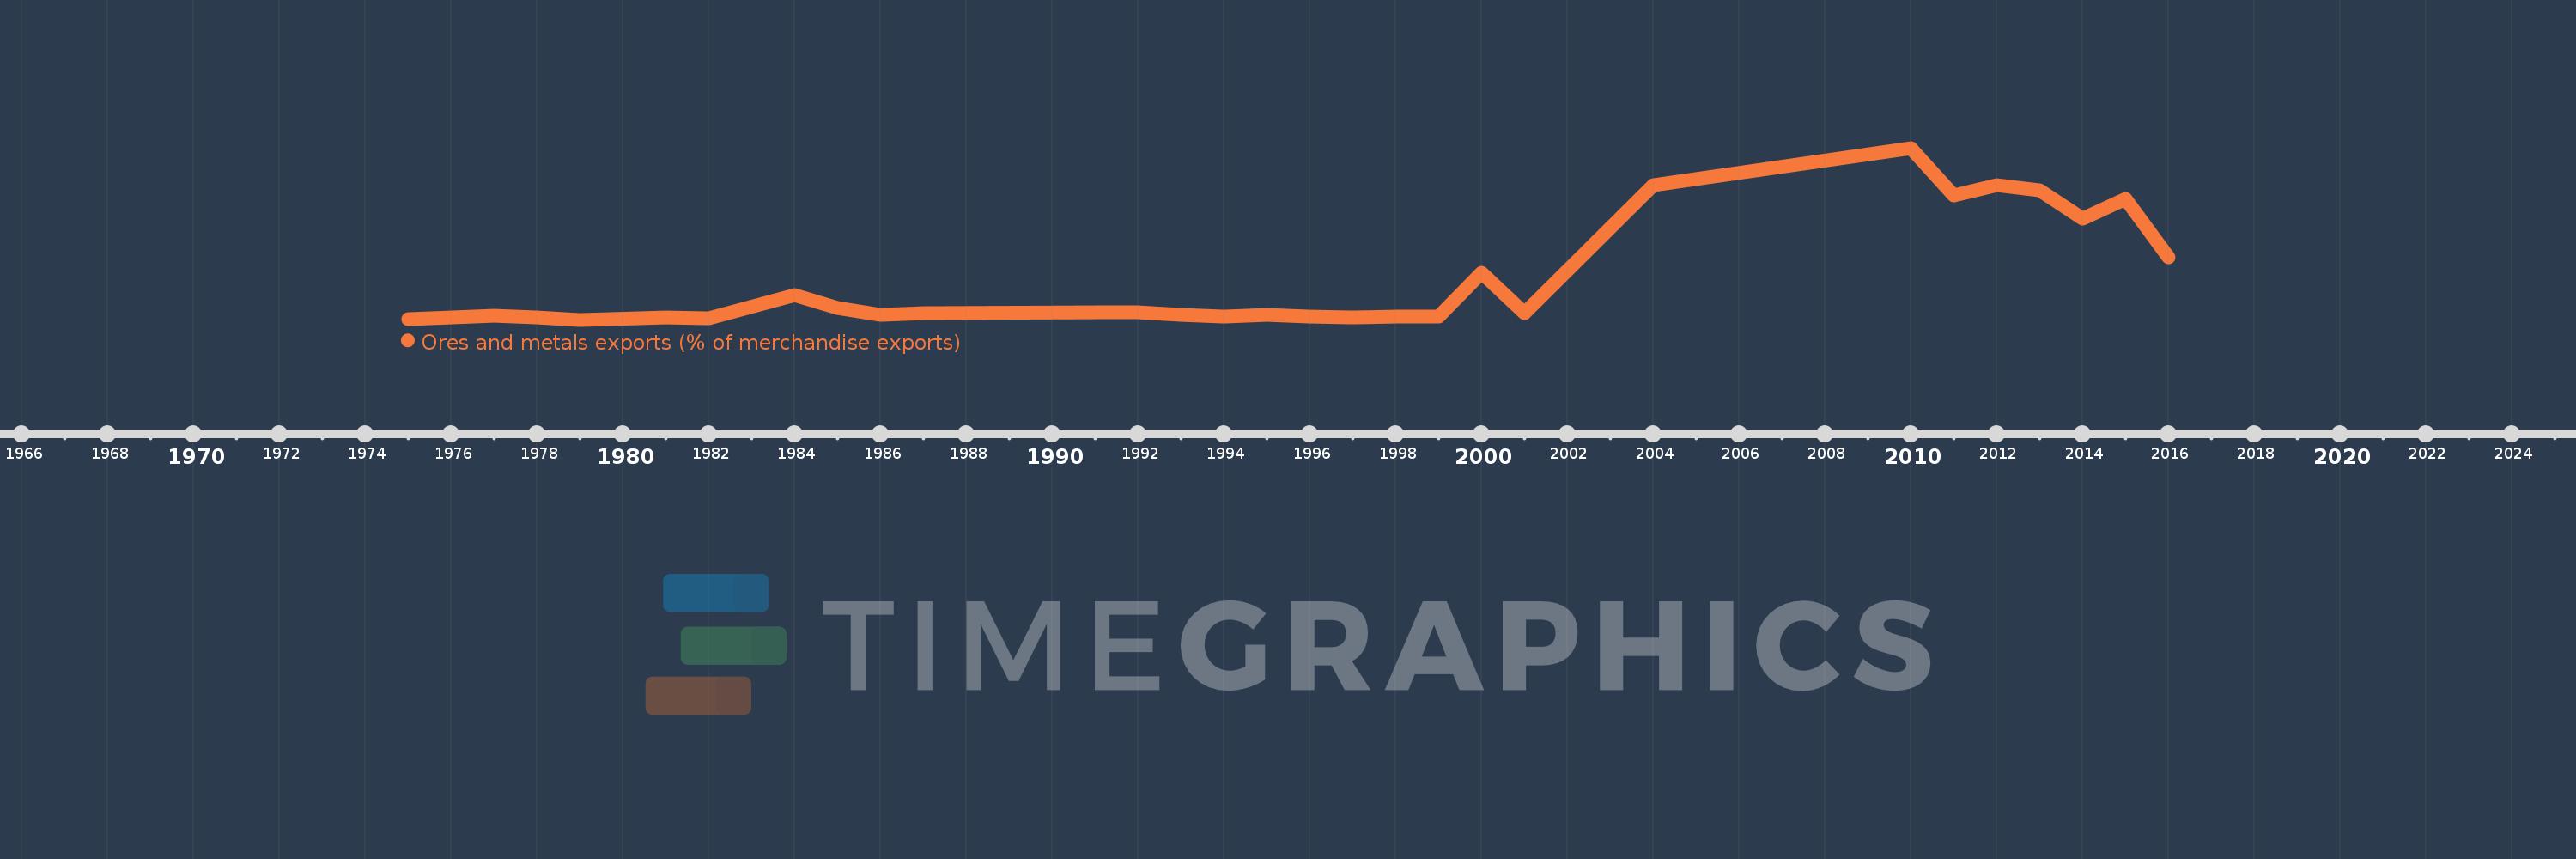
Ores and metals exports (% of merchandise exports)
2016,2015,2014,2013,2012,2011,2010,2004,2001,2000,1999,1998,1997,1996,1995,1994,1993,1992,1991,1987,1986,1985,1984,1982,1981,1979,1978,1977,1975
This statistics in other country:
AfghanistanAlbaniaAlgeriaAndorraAngolaAntigua and BarbudaArab WorldArgentinaArmeniaArubaAustraliaAustriaAzerbaijanBahamas, TheBahrainBangladeshBarbadosBelarusBelgiumBelizeBeninBermudaBhutanBoliviaBosnia and HerzegovinaBotswanaBrazilBrunei DarussalamBulgariaBurkina FasoBurundiCabo VerdeCambodiaCameroonCanadaCaribbean small statesCayman IslandsCentral African RepublicCentral Europe and the BalticsChadChileChinaColombiaComorosCongo, Dem. Rep.Congo, Rep.Costa RicaCote d'IvoireCroatiaCubaCyprusCzech RepublicDenmarkDjiboutiDominicaDominican RepublicEarly-demographic dividendEast Asia & PacificEast Asia & Pacific (excluding high income)East Asia & Pacific (IDA & IBRD countries)EcuadorEgypt, Arab Rep.El SalvadorEquatorial GuineaEritreaEstoniaEthiopiaEuro areaEurope & Central AsiaEurope & Central Asia (excluding high income)Europe & Central Asia (IDA & IBRD countries)European UnionFaroe IslandsFijiFinlandFragile and conflict affected situationsFranceFrench PolynesiaGabonGambia, TheGeorgiaGermanyGhanaGreeceGreenlandGrenadaGuatemalaGuineaGuinea-BissauGuyanaHaitiHeavily indebted poor countries (HIPC)High incomeHondurasHong Kong SAR, ChinaHungaryIBRD onlyIcelandIDA & IBRD totalIDA blendIDA onlyIDA totalIndiaIndonesiaIran, Islamic Rep.IraqIrelandIsraelItalyJamaicaJapanJordanKazakhstanKenyaKiribatiKorea, Rep.KuwaitKyrgyz RepublicLao PDRLate-demographic dividendLatin America & Caribbean Latin America & Caribbean (excluding high income)Latin America & the Caribbean (IDA & IBRD countries)LatviaLeast developed countries: UN classificationLebanonLesothoLiberiaLibyaLithuaniaLow & middle incomeLower middle incomeLuxembourgMacao SAR, ChinaMacedonia, FYRMadagascarMalawiMalaysiaMaldivesMaliMaltaMauritaniaMauritiusMexicoMiddle East & North AfricaMiddle East & North Africa (excluding high income)Middle East & North Africa (IDA & IBRD countries)Middle incomeMoldovaMongoliaMoroccoMozambiqueMyanmarNamibiaNepalNetherlandsNew CaledoniaNew ZealandNicaraguaNigerNigeriaNorth AmericaNorwayOECD membersOmanOther small statesPacific island small statesPakistanPalauPanamaPapua New GuineaParaguayPeruPhilippinesPolandPortugalPost-demographic dividendPre-demographic dividendQatarRomaniaRussian FederationRwandaSamoaSao Tome and PrincipeSaudi ArabiaSenegalSerbiaSeychellesSierra LeoneSingaporeSlovak RepublicSloveniaSmall statesSolomon IslandsSomaliaSouth AfricaSouth AsiaSouth Asia (IDA & IBRD)SpainSri LankaSt. Kitts and NevisSt. LuciaSt. Vincent and the GrenadinesSub-Saharan Africa Sub-Saharan Africa (excluding high income)Sub-Saharan Africa (IDA & IBRD countries)SudanSurinameSwazilandSwedenSwitzerlandSyrian Arab RepublicTajikistanTanzaniaThailandTimor-LesteTogoTongaTrinidad and TobagoTunisiaTurkeyTurkmenistanTurks and Caicos IslandsUgandaUkraineUnited Arab EmiratesUnited KingdomUnited StatesUpper middle incomeUruguayVanuatuVenezuela, RBVietnamVirgin Islands (U.S.)WorldYemen, Rep.ZambiaZimbabwe Timeline:
This timeline shows a graph from 1975 to 2016 of Nepal. No data until 1974. Number of actual observations by date: 29.
Source name:
World Development Indicators
Source organization:
World Bank staff estimates from the Comtrade database maintained by the United Nations Statistics Division.
Categories, topics:
Energy & Mining, Private Sector, Trade
Last updated:
apr 23, 2017
Indicators value changes by year
At the date of observation
Value
Absolute change
Change from previous value
jan 1, 1975
0.052
+0.052
0.0%
jan 1, 1977
0.169
+0.117
224.87%
jan 1, 1978
0.09
-0.078
-46.37%
jan 1, 1979
0.028
-0.063
-69.49%
jan 1, 1981
0.092
+0.064
231.59%
jan 1, 1982
0.069
-0.023
-24.66%
jan 1, 1984
0.801
+0.732
1.06K%
jan 1, 1985
0.392
-0.409
-51.09%
jan 1, 1986
0.188
-0.204
-52.04%
jan 1, 1987
0.245
+0.057
30.15%
jan 1, 1991
0.273
+0.028
11.54%
jan 1, 1992
0.262
-0.011
-3.93%
jan 1, 1993
0.17
-0.092
-35.26%
jan 1, 1994
0.142
-0.028
-16.49%
jan 1, 1995
0.185
+0.043
30.6%
jan 1, 1996
0.135
-0.05
-27.23%
jan 1, 1997
0.088
-0.047
-34.82%
jan 1, 1998
0.119
+0.031
35.59%
jan 1, 1999
0.14
+0.021
18.04%
jan 1, 2000
1.507
+1.366
972.63%
jan 1, 2001
0.235
-1.272
-84.43%
jan 1, 2004
4.294
+4.06
1.73K%
jan 1, 2010
5.465
+1.171
27.27%
jan 1, 2011
3.96
-1.505
-27.54%
jan 1, 2012
4.288
+0.328
8.29%
jan 1, 2013
4.123
-0.165
-3.84%
jan 1, 2014
3.219
-0.904
-21.92%
jan 1, 2015
3.86
+0.64
19.88%
jan 1, 2016
2.007
-1.853
-48.0%
Ranking of countries by current statistics by years


Comments: