29
/
en
AIzaSyAYiBZKx7MnpbEhh9jyipgxe19OcubqV5w
April 1, 2024
150828
Honduras
HND
true
2
1
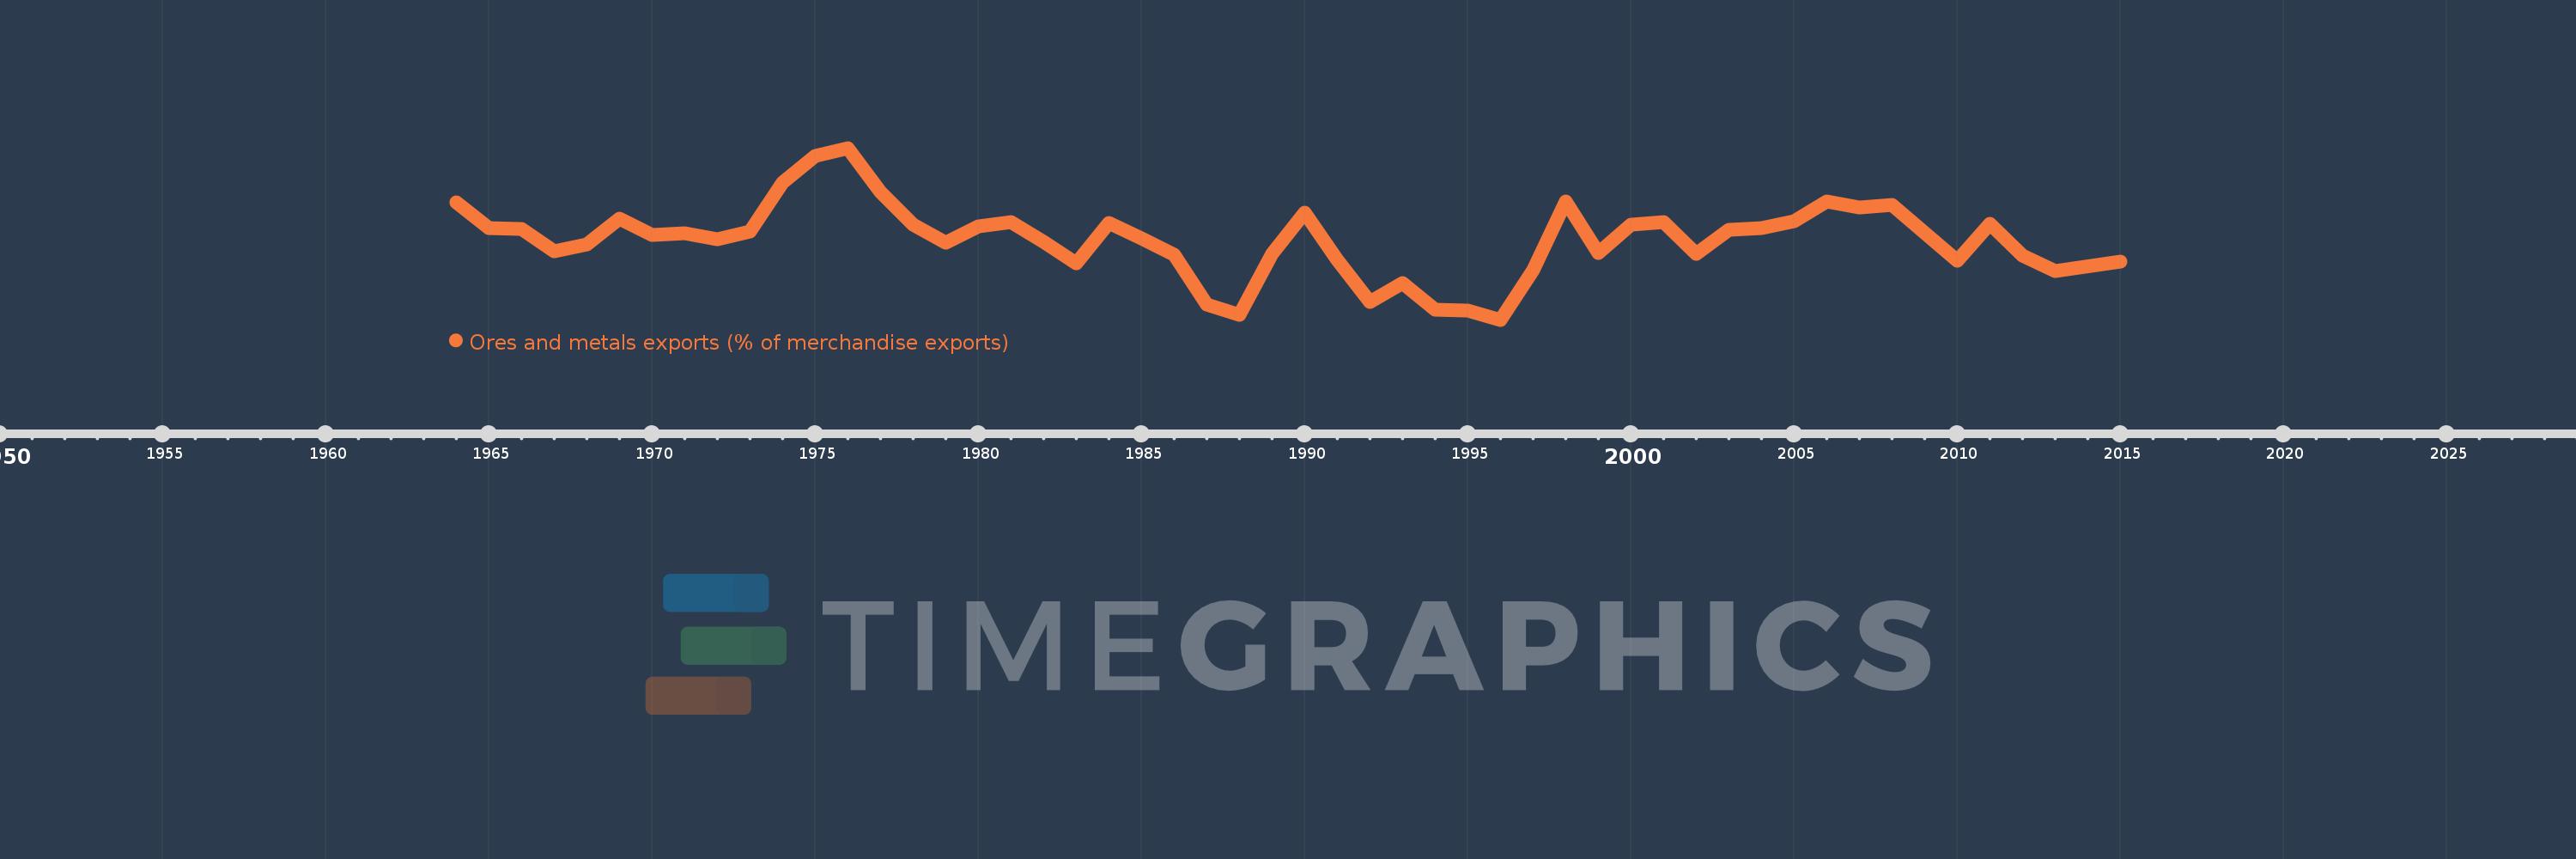
Ores and metals exports (% of merchandise exports)
2015,2013,2012,2011,2010,2008,2007,2006,2005,2004,2003,2002,2001,2000,1999,1998,1997,1996,1995,1994,1993,1992,1991,1990,1989,1988,1987,1986,1985,1984,1983,1982,1981,1980,1979,1978,1977,1976,1975,1974,1973,1972,1971,1970,1969,1968,1967,1966,1965,1964
This statistics in other country:
AfghanistanAlbaniaAlgeriaAndorraAngolaAntigua and BarbudaArab WorldArgentinaArmeniaArubaAustraliaAustriaAzerbaijanBahamas, TheBahrainBangladeshBarbadosBelarusBelgiumBelizeBeninBermudaBhutanBoliviaBosnia and HerzegovinaBotswanaBrazilBrunei DarussalamBulgariaBurkina FasoBurundiCabo VerdeCambodiaCameroonCanadaCaribbean small statesCayman IslandsCentral African RepublicCentral Europe and the BalticsChadChileChinaColombiaComorosCongo, Dem. Rep.Congo, Rep.Costa RicaCote d'IvoireCroatiaCubaCyprusCzech RepublicDenmarkDjiboutiDominicaDominican RepublicEarly-demographic dividendEast Asia & PacificEast Asia & Pacific (excluding high income)East Asia & Pacific (IDA & IBRD countries)EcuadorEgypt, Arab Rep.El SalvadorEquatorial GuineaEritreaEstoniaEthiopiaEuro areaEurope & Central AsiaEurope & Central Asia (excluding high income)Europe & Central Asia (IDA & IBRD countries)European UnionFaroe IslandsFijiFinlandFragile and conflict affected situationsFranceFrench PolynesiaGabonGambia, TheGeorgiaGermanyGhanaGreeceGreenlandGrenadaGuatemalaGuineaGuinea-BissauGuyanaHaitiHeavily indebted poor countries (HIPC)High incomeHondurasHong Kong SAR, ChinaHungaryIBRD onlyIcelandIDA & IBRD totalIDA blendIDA onlyIDA totalIndiaIndonesiaIran, Islamic Rep.IraqIrelandIsraelItalyJamaicaJapanJordanKazakhstanKenyaKiribatiKorea, Rep.KuwaitKyrgyz RepublicLao PDRLate-demographic dividendLatin America & Caribbean Latin America & Caribbean (excluding high income)Latin America & the Caribbean (IDA & IBRD countries)LatviaLeast developed countries: UN classificationLebanonLesothoLiberiaLibyaLithuaniaLow & middle incomeLower middle incomeLuxembourgMacao SAR, ChinaMacedonia, FYRMadagascarMalawiMalaysiaMaldivesMaliMaltaMauritaniaMauritiusMexicoMiddle East & North AfricaMiddle East & North Africa (excluding high income)Middle East & North Africa (IDA & IBRD countries)Middle incomeMoldovaMongoliaMoroccoMozambiqueMyanmarNamibiaNepalNetherlandsNew CaledoniaNew ZealandNicaraguaNigerNigeriaNorth AmericaNorwayOECD membersOmanOther small statesPacific island small statesPakistanPalauPanamaPapua New GuineaParaguayPeruPhilippinesPolandPortugalPost-demographic dividendPre-demographic dividendQatarRomaniaRussian FederationRwandaSamoaSao Tome and PrincipeSaudi ArabiaSenegalSerbiaSeychellesSierra LeoneSingaporeSlovak RepublicSloveniaSmall statesSolomon IslandsSomaliaSouth AfricaSouth AsiaSouth Asia (IDA & IBRD)SpainSri LankaSt. Kitts and NevisSt. LuciaSt. Vincent and the GrenadinesSub-Saharan Africa Sub-Saharan Africa (excluding high income)Sub-Saharan Africa (IDA & IBRD countries)SudanSurinameSwazilandSwedenSwitzerlandSyrian Arab RepublicTajikistanTanzaniaThailandTimor-LesteTogoTongaTrinidad and TobagoTunisiaTurkeyTurkmenistanTurks and Caicos IslandsUgandaUkraineUnited Arab EmiratesUnited KingdomUnited StatesUpper middle incomeUruguayVanuatuVenezuela, RBVietnamVirgin Islands (U.S.)WorldYemen, Rep.ZambiaZimbabwe Timeline:
This timeline shows a graph from 1964 to 2015 of Honduras. No data until 1963. Number of actual observations by date: 50.
Source name:
World Development Indicators
Source organization:
World Bank staff estimates from the Comtrade database maintained by the United Nations Statistics Division.
Categories, topics:
Energy & Mining, Private Sector, Trade
Last updated:
apr 23, 2017
Indicators value changes by year
Maximum:
11.069
jan 1, 1976
At the date of observation
Value
Absolute change
Change from previous value
jan 1, 1964
7.736
+7.736
0.0%
jan 1, 1965
6.101
-1.636
-21.14%
jan 1, 1966
6.069
-0.031
-0.51%
jan 1, 1967
4.719
-1.35
-22.25%
jan 1, 1968
5.132
+0.413
8.75%
jan 1, 1969
6.732
+1.6
31.18%
jan 1, 1970
5.703
-1.028
-15.27%
jan 1, 1971
5.794
+0.09
1.58%
jan 1, 1972
5.418
-0.375
-6.47%
jan 1, 1973
5.912
+0.493
9.1%
jan 1, 1974
8.936
+3.024
51.16%
jan 1, 1975
10.6
+1.664
18.62%
jan 1, 1976
11.069
+0.468
4.42%
jan 1, 1977
8.365
-2.703
-24.42%
jan 1, 1978
6.361
-2.004
-23.96%
jan 1, 1979
5.2
-1.161
-18.25%
jan 1, 1980
6.244
+1.044
20.07%
jan 1, 1981
6.484
+0.24
3.85%
jan 1, 1982
5.283
-1.201
-18.52%
jan 1, 1983
3.958
-1.325
-25.09%
jan 1, 1984
6.46
+2.502
63.22%
jan 1, 1985
5.478
-0.982
-15.2%
jan 1, 1986
4.482
-0.997
-18.19%
jan 1, 1987
1.412
-3.069
-68.49%
jan 1, 1988
0.768
-0.644
-45.6%
jan 1, 1989
4.511
+3.743
487.17%
jan 1, 1990
7.066
+2.555
56.65%
jan 1, 1991
4.165
-2.902
-41.06%
jan 1, 1992
1.551
-2.613
-62.75%
jan 1, 1993
2.737
+1.186
76.42%
jan 1, 1994
1.097
-1.64
-59.91%
jan 1, 1995
1.055
-0.042
-3.81%
jan 1, 1996
0.468
-0.587
-55.66%
jan 1, 1997
3.506
+3.038
649.25%
jan 1, 1998
7.786
+4.28
122.06%
jan 1, 1999
4.595
-3.191
-40.98%
jan 1, 2000
6.327
+1.733
37.71%
jan 1, 2001
6.474
+0.147
2.32%
jan 1, 2002
4.514
-1.96
-30.28%
jan 1, 2003
5.999
+1.486
32.91%
jan 1, 2004
6.125
+0.125
2.09%
jan 1, 2005
6.552
+0.427
6.98%
jan 1, 2006
7.742
+1.19
18.17%
jan 1, 2007
7.372
-0.371
-4.79%
jan 1, 2008
7.538
+0.167
2.26%
jan 1, 2010
4.135
-3.404
-45.15%
jan 1, 2011
6.366
+2.231
53.97%
jan 1, 2012
4.436
-1.93
-30.32%
jan 1, 2013
3.484
-0.952
-21.46%
jan 1, 2015
4.045
+0.561
16.09%
Ranking of countries by current statistics by years


Comments: