29
/
en
AIzaSyAYiBZKx7MnpbEhh9jyipgxe19OcubqV5w
April 1, 2024
246043
South Africa
ZAF
true
2
1
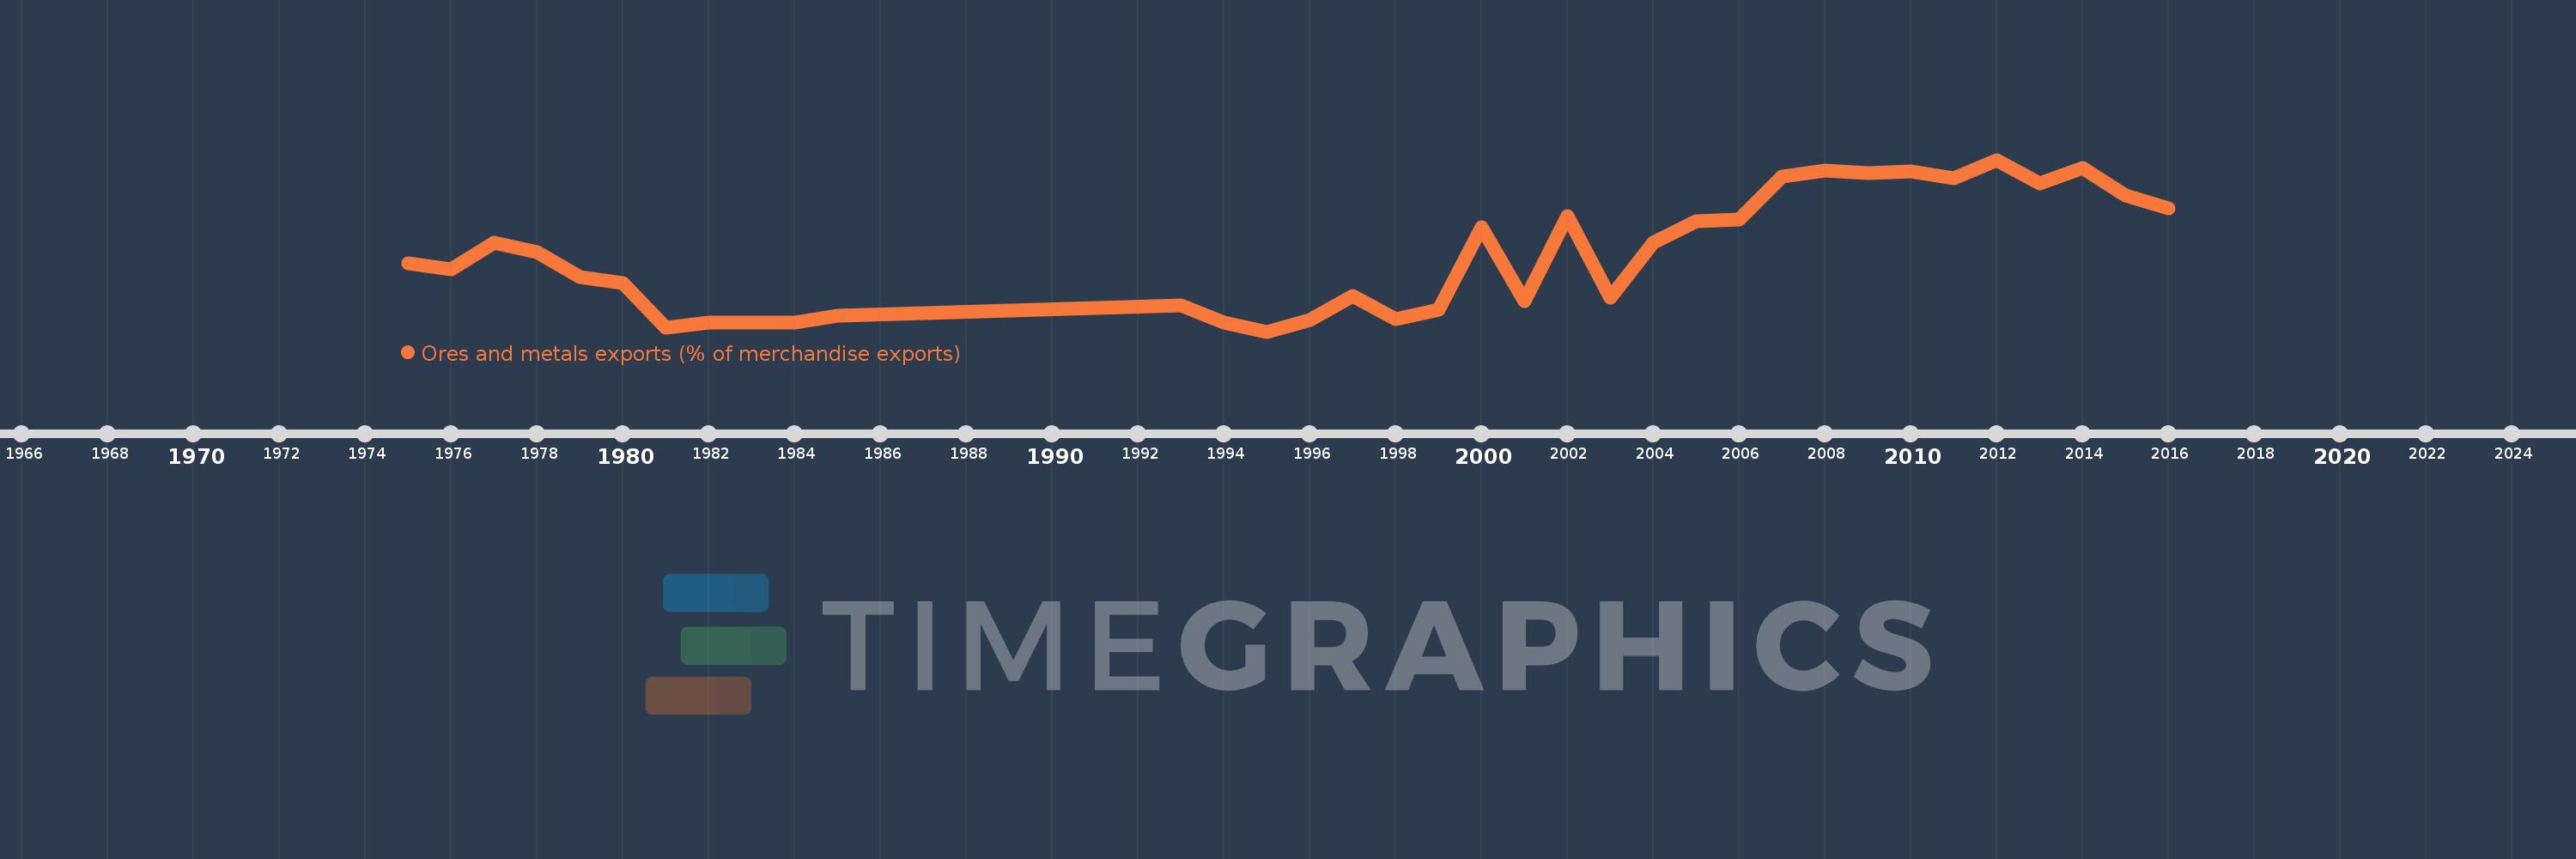
Ores and metals exports (% of merchandise exports)
2016,2015,2014,2013,2012,2011,2010,2009,2008,2007,2006,2005,2004,2003,2002,2001,2000,1999,1998,1997,1996,1995,1994,1993,1985,1984,1983,1982,1981,1980,1979,1978,1977,1976,1975
This statistics in other country:
AfghanistanAlbaniaAlgeriaAndorraAngolaAntigua and BarbudaArab WorldArgentinaArmeniaArubaAustraliaAustriaAzerbaijanBahamas, TheBahrainBangladeshBarbadosBelarusBelgiumBelizeBeninBermudaBhutanBoliviaBosnia and HerzegovinaBotswanaBrazilBrunei DarussalamBulgariaBurkina FasoBurundiCabo VerdeCambodiaCameroonCanadaCaribbean small statesCayman IslandsCentral African RepublicCentral Europe and the BalticsChadChileChinaColombiaComorosCongo, Dem. Rep.Congo, Rep.Costa RicaCote d'IvoireCroatiaCubaCyprusCzech RepublicDenmarkDjiboutiDominicaDominican RepublicEarly-demographic dividendEast Asia & PacificEast Asia & Pacific (excluding high income)East Asia & Pacific (IDA & IBRD countries)EcuadorEgypt, Arab Rep.El SalvadorEquatorial GuineaEritreaEstoniaEthiopiaEuro areaEurope & Central AsiaEurope & Central Asia (excluding high income)Europe & Central Asia (IDA & IBRD countries)European UnionFaroe IslandsFijiFinlandFragile and conflict affected situationsFranceFrench PolynesiaGabonGambia, TheGeorgiaGermanyGhanaGreeceGreenlandGrenadaGuatemalaGuineaGuinea-BissauGuyanaHaitiHeavily indebted poor countries (HIPC)High incomeHondurasHong Kong SAR, ChinaHungaryIBRD onlyIcelandIDA & IBRD totalIDA blendIDA onlyIDA totalIndiaIndonesiaIran, Islamic Rep.IraqIrelandIsraelItalyJamaicaJapanJordanKazakhstanKenyaKiribatiKorea, Rep.KuwaitKyrgyz RepublicLao PDRLate-demographic dividendLatin America & Caribbean Latin America & Caribbean (excluding high income)Latin America & the Caribbean (IDA & IBRD countries)LatviaLeast developed countries: UN classificationLebanonLesothoLiberiaLibyaLithuaniaLow & middle incomeLower middle incomeLuxembourgMacao SAR, ChinaMacedonia, FYRMadagascarMalawiMalaysiaMaldivesMaliMaltaMauritaniaMauritiusMexicoMiddle East & North AfricaMiddle East & North Africa (excluding high income)Middle East & North Africa (IDA & IBRD countries)Middle incomeMoldovaMongoliaMoroccoMozambiqueMyanmarNamibiaNepalNetherlandsNew CaledoniaNew ZealandNicaraguaNigerNigeriaNorth AmericaNorwayOECD membersOmanOther small statesPacific island small statesPakistanPalauPanamaPapua New GuineaParaguayPeruPhilippinesPolandPortugalPost-demographic dividendPre-demographic dividendQatarRomaniaRussian FederationRwandaSamoaSao Tome and PrincipeSaudi ArabiaSenegalSerbiaSeychellesSierra LeoneSingaporeSlovak RepublicSloveniaSmall statesSolomon IslandsSomaliaSouth AfricaSouth AsiaSouth Asia (IDA & IBRD)SpainSri LankaSt. Kitts and NevisSt. LuciaSt. Vincent and the GrenadinesSub-Saharan Africa Sub-Saharan Africa (excluding high income)Sub-Saharan Africa (IDA & IBRD countries)SudanSurinameSwazilandSwedenSwitzerlandSyrian Arab RepublicTajikistanTanzaniaThailandTimor-LesteTogoTongaTrinidad and TobagoTunisiaTurkeyTurkmenistanTurks and Caicos IslandsUgandaUkraineUnited Arab EmiratesUnited KingdomUnited StatesUpper middle incomeUruguayVanuatuVenezuela, RBVietnamVirgin Islands (U.S.)WorldYemen, Rep.ZambiaZimbabwe Timeline:
This timeline shows a graph from 1975 to 2016 of South Africa. No data until 1974. Number of actual observations by date: 35.
Source name:
World Development Indicators
Source organization:
World Bank staff estimates from the Comtrade database maintained by the United Nations Statistics Division.
Categories, topics:
Energy & Mining, Private Sector, Trade
Last updated:
apr 23, 2017
Indicators value changes by year
At the date of observation
Value
Absolute change
Change from previous value
jan 1, 1975
16.14
+16.14
0.0%
jan 1, 1976
15.364
-0.776
-4.81%
jan 1, 1977
19.111
+3.747
24.39%
jan 1, 1978
17.839
-1.273
-6.66%
jan 1, 1979
14.282
-3.557
-19.94%
jan 1, 1980
13.386
-0.896
-6.27%
jan 1, 1981
6.958
-6.429
-48.02%
jan 1, 1982
7.658
+0.7
10.07%
jan 1, 1983
7.726
+0.068
0.89%
jan 1, 1984
7.7
-0.026
-0.33%
jan 1, 1985
8.694
+0.994
12.91%
jan 1, 1993
10.153
+1.459
16.78%
jan 1, 1994
7.701
-2.452
-24.15%
jan 1, 1995
6.424
-1.278
-16.59%
jan 1, 1996
8.069
+1.645
25.61%
jan 1, 1997
11.551
+3.482
43.16%
jan 1, 1998
8.212
-3.339
-28.91%
jan 1, 1999
9.562
+1.35
16.44%
jan 1, 2000
21.313
+11.751
122.89%
jan 1, 2001
10.754
-10.559
-49.54%
jan 1, 2002
22.916
+12.162
113.09%
jan 1, 2003
11.264
-11.652
-50.85%
jan 1, 2004
19.155
+7.891
70.06%
jan 1, 2005
22.178
+3.023
15.78%
jan 1, 2006
22.446
+0.268
1.21%
jan 1, 2007
28.581
+6.135
27.33%
jan 1, 2008
29.53
+0.949
3.32%
jan 1, 2009
29.127
-0.403
-1.36%
jan 1, 2010
29.337
+0.21
0.72%
jan 1, 2011
28.31
-1.027
-3.5%
jan 1, 2012
31.01
+2.7
9.54%
jan 1, 2013
27.677
-3.333
-10.75%
jan 1, 2014
29.867
+2.19
7.91%
jan 1, 2015
25.89
-3.977
-13.32%
jan 1, 2016
24.013
-1.877
-7.25%
Ranking of countries by current statistics by years


Comments: