29
/
en
AIzaSyAYiBZKx7MnpbEhh9jyipgxe19OcubqV5w
April 1, 2024
194677
Mauritius
MUS
true
2
1
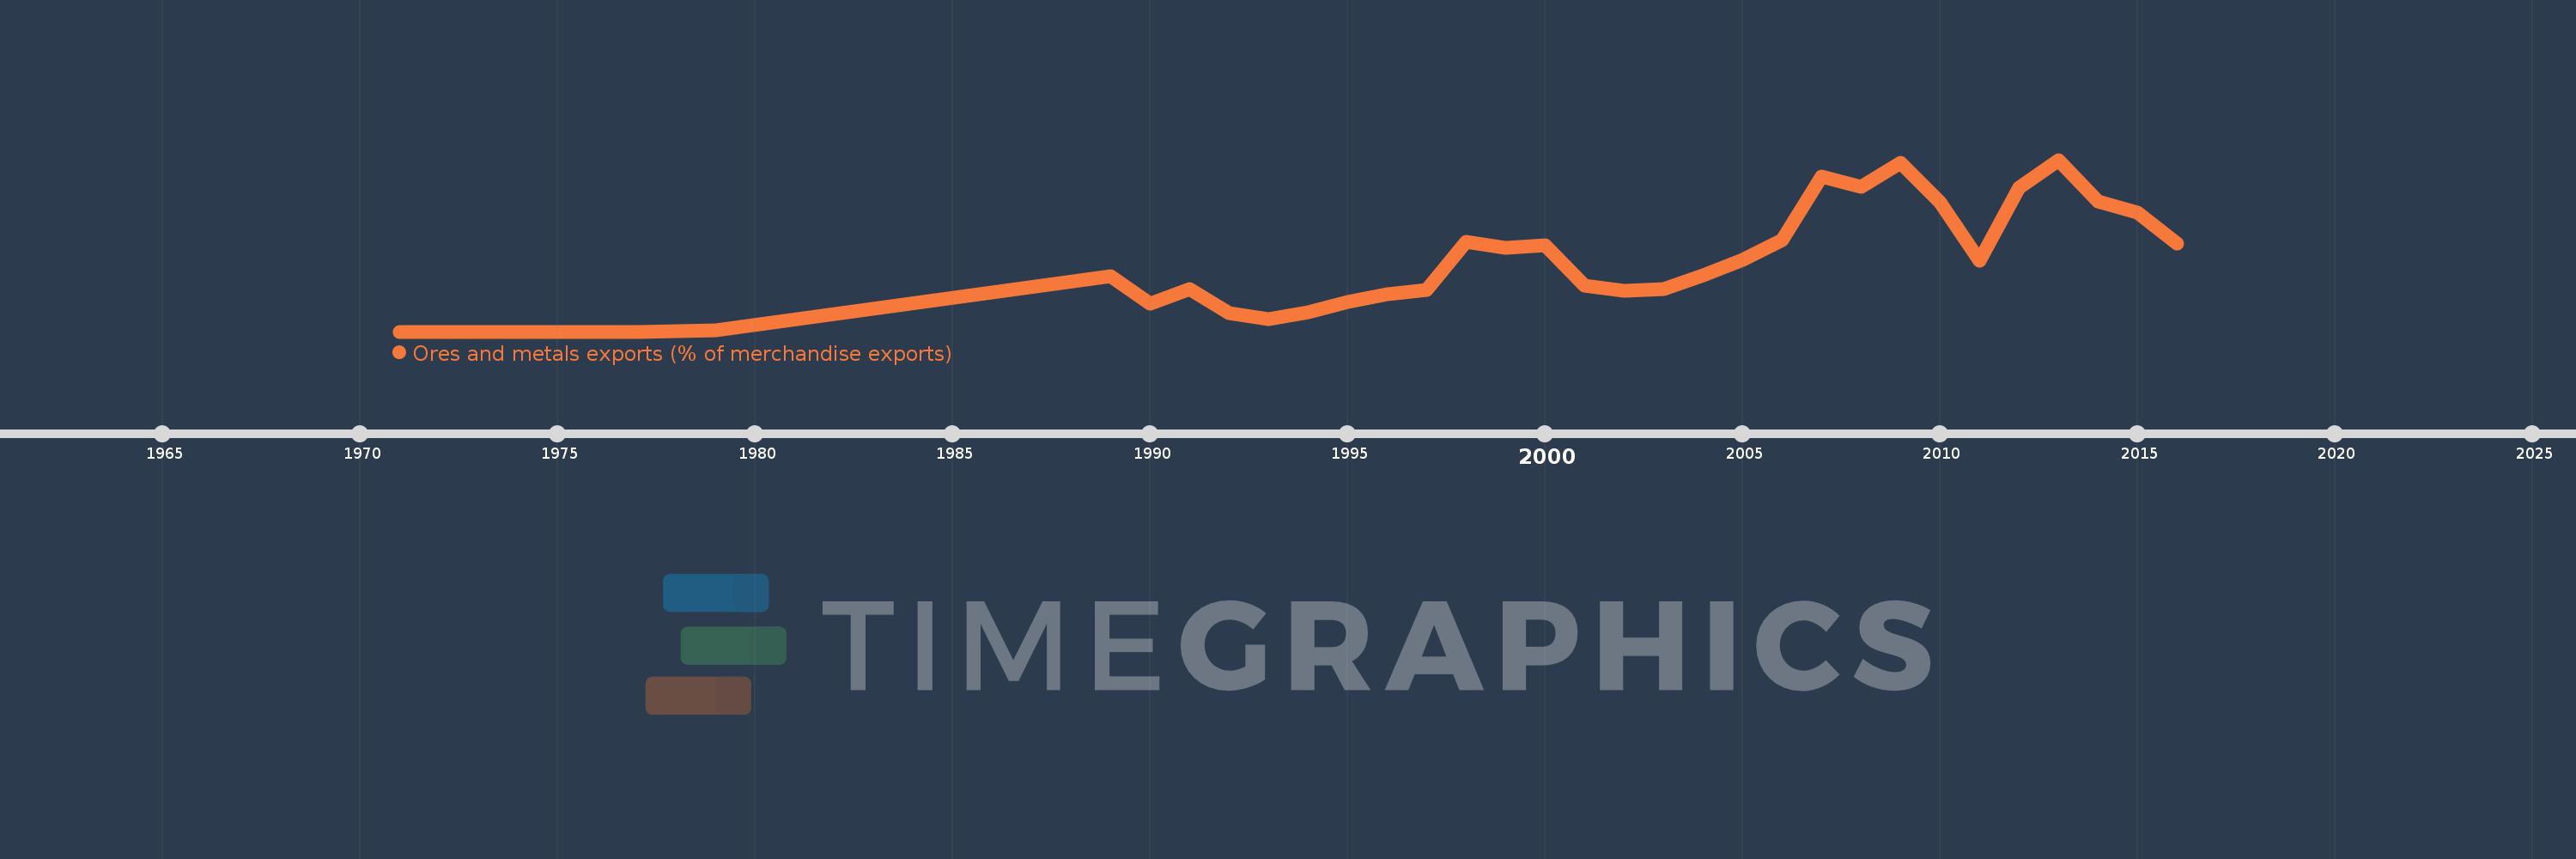
Ores and metals exports (% of merchandise exports)
2016,2015,2014,2013,2012,2011,2010,2009,2008,2007,2006,2005,2004,2003,2002,2001,2000,1999,1998,1997,1996,1995,1994,1993,1992,1991,1990,1989,1979,1978,1977,1976,1975,1974,1973,1972,1971
This statistics in other country:
AfghanistanAlbaniaAlgeriaAndorraAngolaAntigua and BarbudaArab WorldArgentinaArmeniaArubaAustraliaAustriaAzerbaijanBahamas, TheBahrainBangladeshBarbadosBelarusBelgiumBelizeBeninBermudaBhutanBoliviaBosnia and HerzegovinaBotswanaBrazilBrunei DarussalamBulgariaBurkina FasoBurundiCabo VerdeCambodiaCameroonCanadaCaribbean small statesCayman IslandsCentral African RepublicCentral Europe and the BalticsChadChileChinaColombiaComorosCongo, Dem. Rep.Congo, Rep.Costa RicaCote d'IvoireCroatiaCubaCyprusCzech RepublicDenmarkDjiboutiDominicaDominican RepublicEarly-demographic dividendEast Asia & PacificEast Asia & Pacific (excluding high income)East Asia & Pacific (IDA & IBRD countries)EcuadorEgypt, Arab Rep.El SalvadorEquatorial GuineaEritreaEstoniaEthiopiaEuro areaEurope & Central AsiaEurope & Central Asia (excluding high income)Europe & Central Asia (IDA & IBRD countries)European UnionFaroe IslandsFijiFinlandFragile and conflict affected situationsFranceFrench PolynesiaGabonGambia, TheGeorgiaGermanyGhanaGreeceGreenlandGrenadaGuatemalaGuineaGuinea-BissauGuyanaHaitiHeavily indebted poor countries (HIPC)High incomeHondurasHong Kong SAR, ChinaHungaryIBRD onlyIcelandIDA & IBRD totalIDA blendIDA onlyIDA totalIndiaIndonesiaIran, Islamic Rep.IraqIrelandIsraelItalyJamaicaJapanJordanKazakhstanKenyaKiribatiKorea, Rep.KuwaitKyrgyz RepublicLao PDRLate-demographic dividendLatin America & Caribbean Latin America & Caribbean (excluding high income)Latin America & the Caribbean (IDA & IBRD countries)LatviaLeast developed countries: UN classificationLebanonLesothoLiberiaLibyaLithuaniaLow & middle incomeLower middle incomeLuxembourgMacao SAR, ChinaMacedonia, FYRMadagascarMalawiMalaysiaMaldivesMaliMaltaMauritaniaMauritiusMexicoMiddle East & North AfricaMiddle East & North Africa (excluding high income)Middle East & North Africa (IDA & IBRD countries)Middle incomeMoldovaMongoliaMoroccoMozambiqueMyanmarNamibiaNepalNetherlandsNew CaledoniaNew ZealandNicaraguaNigerNigeriaNorth AmericaNorwayOECD membersOmanOther small statesPacific island small statesPakistanPalauPanamaPapua New GuineaParaguayPeruPhilippinesPolandPortugalPost-demographic dividendPre-demographic dividendQatarRomaniaRussian FederationRwandaSamoaSao Tome and PrincipeSaudi ArabiaSenegalSerbiaSeychellesSierra LeoneSingaporeSlovak RepublicSloveniaSmall statesSolomon IslandsSomaliaSouth AfricaSouth AsiaSouth Asia (IDA & IBRD)SpainSri LankaSt. Kitts and NevisSt. LuciaSt. Vincent and the GrenadinesSub-Saharan Africa Sub-Saharan Africa (excluding high income)Sub-Saharan Africa (IDA & IBRD countries)SudanSurinameSwazilandSwedenSwitzerlandSyrian Arab RepublicTajikistanTanzaniaThailandTimor-LesteTogoTongaTrinidad and TobagoTunisiaTurkeyTurkmenistanTurks and Caicos IslandsUgandaUkraineUnited Arab EmiratesUnited KingdomUnited StatesUpper middle incomeUruguayVanuatuVenezuela, RBVietnamVirgin Islands (U.S.)WorldYemen, Rep.ZambiaZimbabwe Timeline:
This timeline shows a graph from 1971 to 2016 of Mauritius. No data until 1970. Number of actual observations by date: 37.
Source name:
World Development Indicators
Source organization:
World Bank staff estimates from the Comtrade database maintained by the United Nations Statistics Division.
Categories, topics:
Energy & Mining, Private Sector, Trade
Last updated:
apr 23, 2017
Indicators value changes by year
At the date of observation
Value
Absolute change
Change from previous value
jan 1, 1972
0.0
0.0
-40.07%
jan 1, 1973
0.0
+0.0
110.0%
jan 1, 1974
0.0
+0.0
528.91%
jan 1, 1975
0.0
0.0
-4.36%
jan 1, 1977
0.0
0.0
-95.38%
jan 1, 1978
0.002
+0.002
12.28K%
jan 1, 1979
0.005
+0.003
148.51%
jan 1, 1989
0.278
+0.274
5.93K%
jan 1, 1990
0.139
-0.139
-49.94%
jan 1, 1991
0.213
+0.074
53.09%
jan 1, 1992
0.093
-0.12
-56.39%
jan 1, 1993
0.062
-0.031
-33.35%
jan 1, 1994
0.099
+0.037
59.14%
jan 1, 1995
0.149
+0.05
50.98%
jan 1, 1996
0.188
+0.04
26.54%
jan 1, 1997
0.209
+0.021
11.19%
jan 1, 1998
0.451
+0.242
115.43%
jan 1, 1999
0.422
-0.029
-6.37%
jan 1, 2000
0.436
+0.014
3.26%
jan 1, 2001
0.232
-0.204
-46.75%
jan 1, 2002
0.207
-0.025
-10.97%
jan 1, 2003
0.216
+0.009
4.33%
jan 1, 2004
0.284
+0.069
31.84%
jan 1, 2005
0.363
+0.078
27.48%
jan 1, 2006
0.463
+0.1
27.71%
jan 1, 2007
0.783
+0.32
69.05%
jan 1, 2008
0.728
-0.055
-7.0%
jan 1, 2009
0.85
+0.122
16.8%
jan 1, 2010
0.652
-0.198
-23.31%
jan 1, 2011
0.356
-0.296
-45.4%
jan 1, 2012
0.725
+0.369
103.66%
jan 1, 2013
0.866
+0.141
19.48%
jan 1, 2014
0.655
-0.211
-24.38%
jan 1, 2015
0.599
-0.056
-8.57%
jan 1, 2016
0.444
-0.155
-25.82%
Ranking of countries by current statistics by years


Comments: