29
/
en
AIzaSyAYiBZKx7MnpbEhh9jyipgxe19OcubqV5w
April 1, 2024
92890
Brunei Darussalam
BRN
true
2
1
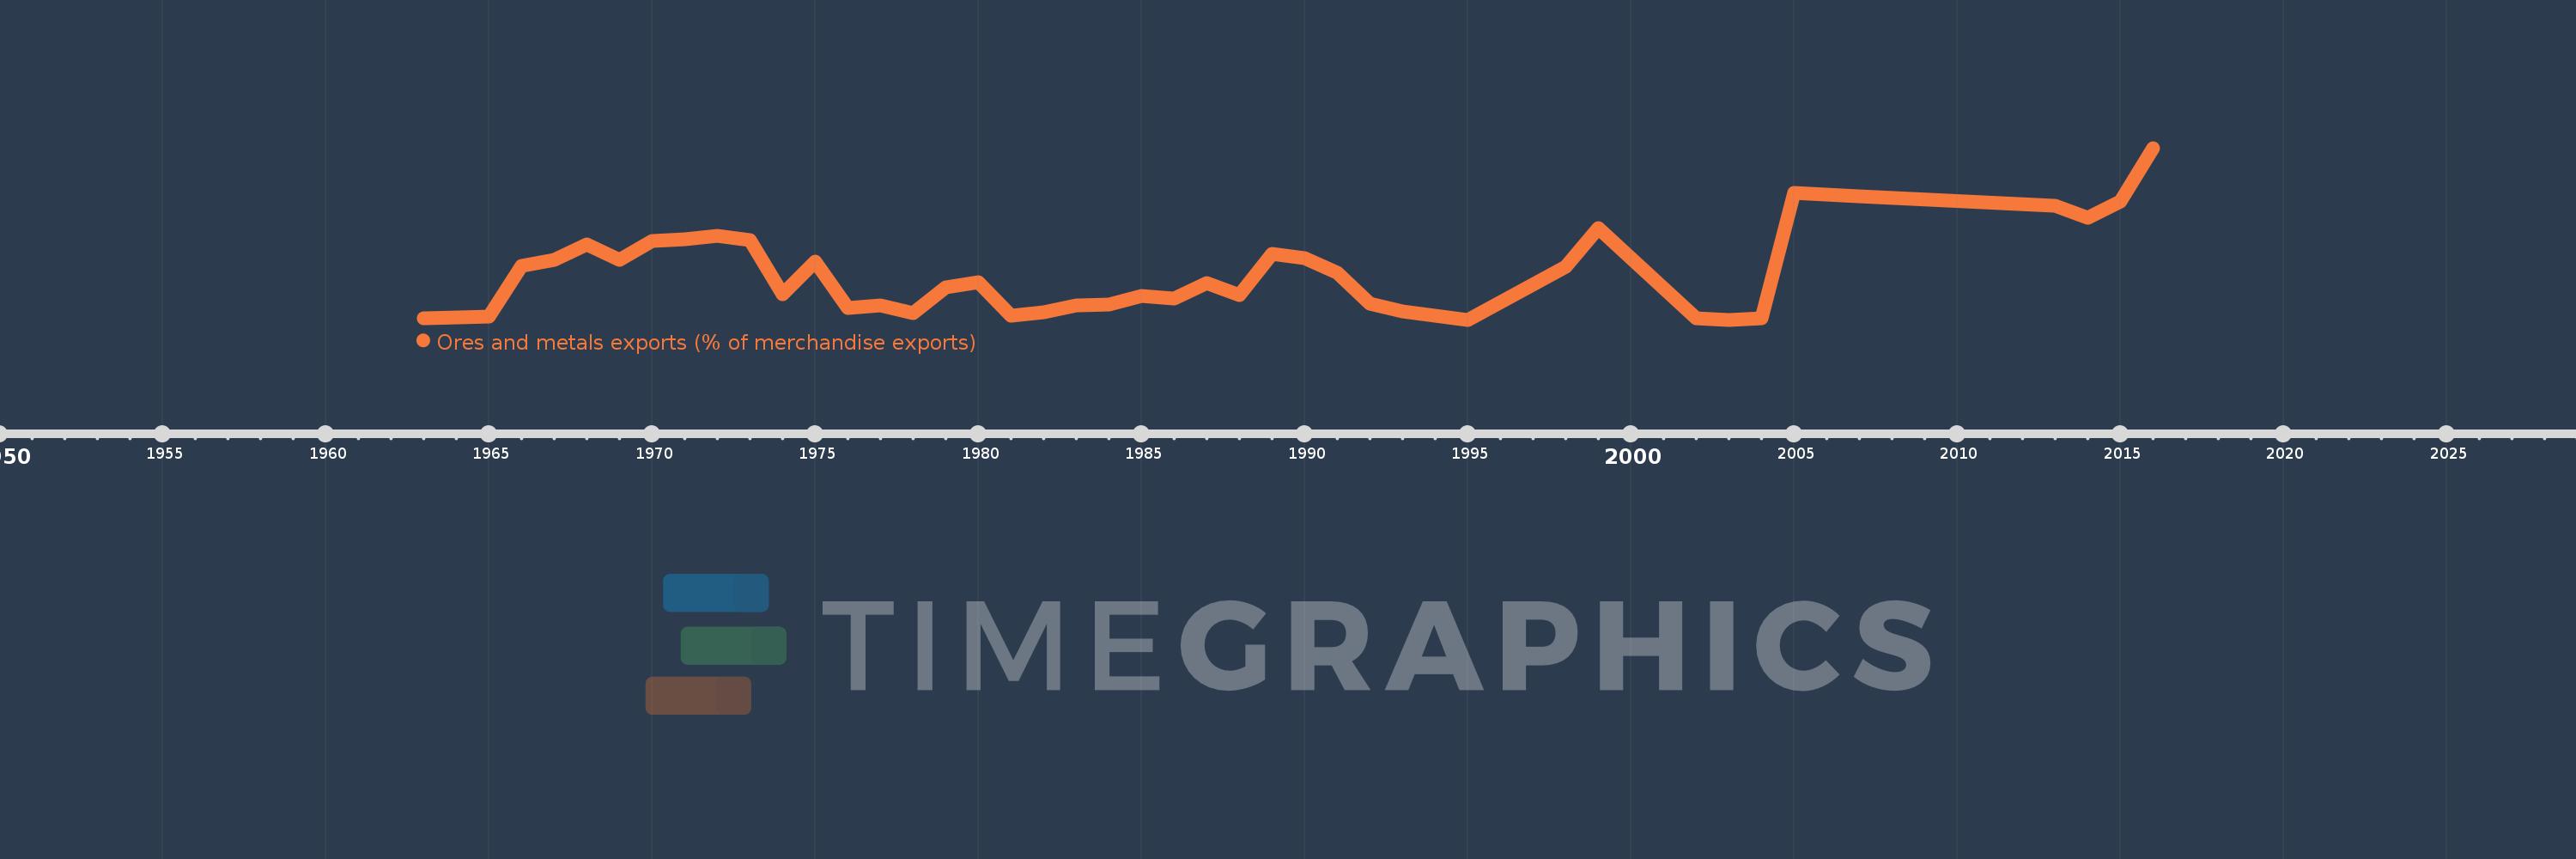
Ores and metals exports (% of merchandise exports)
2016,2015,2014,2013,2007,2005,2004,2003,2002,1999,1998,1995,1993,1992,1991,1990,1989,1988,1987,1986,1985,1984,1983,1982,1981,1980,1979,1978,1977,1976,1975,1974,1973,1972,1971,1970,1969,1968,1967,1966,1965,1964,1963
This statistics in other country:
AfghanistanAlbaniaAlgeriaAndorraAngolaAntigua and BarbudaArab WorldArgentinaArmeniaArubaAustraliaAustriaAzerbaijanBahamas, TheBahrainBangladeshBarbadosBelarusBelgiumBelizeBeninBermudaBhutanBoliviaBosnia and HerzegovinaBotswanaBrazilBrunei DarussalamBulgariaBurkina FasoBurundiCabo VerdeCambodiaCameroonCanadaCaribbean small statesCayman IslandsCentral African RepublicCentral Europe and the BalticsChadChileChinaColombiaComorosCongo, Dem. Rep.Congo, Rep.Costa RicaCote d'IvoireCroatiaCubaCyprusCzech RepublicDenmarkDjiboutiDominicaDominican RepublicEarly-demographic dividendEast Asia & PacificEast Asia & Pacific (excluding high income)East Asia & Pacific (IDA & IBRD countries)EcuadorEgypt, Arab Rep.El SalvadorEquatorial GuineaEritreaEstoniaEthiopiaEuro areaEurope & Central AsiaEurope & Central Asia (excluding high income)Europe & Central Asia (IDA & IBRD countries)European UnionFaroe IslandsFijiFinlandFragile and conflict affected situationsFranceFrench PolynesiaGabonGambia, TheGeorgiaGermanyGhanaGreeceGreenlandGrenadaGuatemalaGuineaGuinea-BissauGuyanaHaitiHeavily indebted poor countries (HIPC)High incomeHondurasHong Kong SAR, ChinaHungaryIBRD onlyIcelandIDA & IBRD totalIDA blendIDA onlyIDA totalIndiaIndonesiaIran, Islamic Rep.IraqIrelandIsraelItalyJamaicaJapanJordanKazakhstanKenyaKiribatiKorea, Rep.KuwaitKyrgyz RepublicLao PDRLate-demographic dividendLatin America & Caribbean Latin America & Caribbean (excluding high income)Latin America & the Caribbean (IDA & IBRD countries)LatviaLeast developed countries: UN classificationLebanonLesothoLiberiaLibyaLithuaniaLow & middle incomeLower middle incomeLuxembourgMacao SAR, ChinaMacedonia, FYRMadagascarMalawiMalaysiaMaldivesMaliMaltaMauritaniaMauritiusMexicoMiddle East & North AfricaMiddle East & North Africa (excluding high income)Middle East & North Africa (IDA & IBRD countries)Middle incomeMoldovaMongoliaMoroccoMozambiqueMyanmarNamibiaNepalNetherlandsNew CaledoniaNew ZealandNicaraguaNigerNigeriaNorth AmericaNorwayOECD membersOmanOther small statesPacific island small statesPakistanPalauPanamaPapua New GuineaParaguayPeruPhilippinesPolandPortugalPost-demographic dividendPre-demographic dividendQatarRomaniaRussian FederationRwandaSamoaSao Tome and PrincipeSaudi ArabiaSenegalSerbiaSeychellesSierra LeoneSingaporeSlovak RepublicSloveniaSmall statesSolomon IslandsSomaliaSouth AfricaSouth AsiaSouth Asia (IDA & IBRD)SpainSri LankaSt. Kitts and NevisSt. LuciaSt. Vincent and the GrenadinesSub-Saharan Africa Sub-Saharan Africa (excluding high income)Sub-Saharan Africa (IDA & IBRD countries)SudanSurinameSwazilandSwedenSwitzerlandSyrian Arab RepublicTajikistanTanzaniaThailandTimor-LesteTogoTongaTrinidad and TobagoTunisiaTurkeyTurkmenistanTurks and Caicos IslandsUgandaUkraineUnited Arab EmiratesUnited KingdomUnited StatesUpper middle incomeUruguayVanuatuVenezuela, RBVietnamVirgin Islands (U.S.)WorldYemen, Rep.ZambiaZimbabwe Timeline:
This timeline shows a graph from 1963 to 2016 of Brunei Darussalam. No data until 1962. Number of actual observations by date: 43.
Source name:
World Development Indicators
Source organization:
World Bank staff estimates from the Comtrade database maintained by the United Nations Statistics Division.
Categories, topics:
Energy & Mining, Private Sector, Trade
Last updated:
apr 23, 2017
Indicators value changes by year
At the date of observation
Value
Absolute change
Change from previous value
jan 1, 1963
0.001
+0.001
0.0%
jan 1, 1964
0.002
+0.001
207.32%
jan 1, 1965
0.003
+0.001
39.54%
jan 1, 1966
0.05
+0.047
1.58K%
jan 1, 1967
0.056
+0.006
11.59%
jan 1, 1968
0.07
+0.014
24.74%
jan 1, 1969
0.056
-0.014
-19.93%
jan 1, 1970
0.073
+0.017
29.77%
jan 1, 1971
0.075
+0.002
2.62%
jan 1, 1972
0.078
+0.003
4.3%
jan 1, 1973
0.074
-0.004
-5.5%
jan 1, 1974
0.024
-0.05
-68.05%
jan 1, 1975
0.054
+0.031
130.96%
jan 1, 1976
0.011
-0.043
-79.28%
jan 1, 1977
0.013
+0.002
17.79%
jan 1, 1978
0.006
-0.007
-56.13%
jan 1, 1979
0.03
+0.024
407.73%
jan 1, 1980
0.035
+0.005
18.08%
jan 1, 1981
0.004
-0.031
-88.01%
jan 1, 1982
0.007
+0.002
59.48%
jan 1, 1983
0.013
+0.006
94.6%
jan 1, 1984
0.014
+0.001
11.19%
jan 1, 1985
0.022
+0.008
53.03%
jan 1, 1986
0.02
-0.002
-8.58%
jan 1, 1987
0.034
+0.014
67.26%
jan 1, 1988
0.023
-0.011
-31.09%
jan 1, 1989
0.061
+0.038
162.43%
jan 1, 1990
0.057
-0.004
-6.8%
jan 1, 1991
0.044
-0.013
-22.41%
jan 1, 1992
0.015
-0.029
-66.38%
jan 1, 1993
0.008
-0.007
-49.26%
jan 1, 1995
0.0
-0.008
-99.96%
jan 1, 1998
0.049
+0.049
1.44 mln%
jan 1, 1999
0.085
+0.037
75.32%
jan 1, 2002
0.001
-0.084
-98.55%
jan 1, 2003
0.0
-0.001
-100.0%
jan 1, 2004
0.001
+0.001
%
jan 1, 2005
0.118
+0.117
15.59K%
jan 1, 2007
0.115
-0.002
-2.0%
jan 1, 2013
0.106
-0.009
-8.0%
jan 1, 2014
0.095
-0.011
-10.58%
jan 1, 2015
0.11
+0.015
15.59%
jan 1, 2016
0.16
+0.05
46.0%
Ranking of countries by current statistics by years


Comments: