29
/
en
AIzaSyAYiBZKx7MnpbEhh9jyipgxe19OcubqV5w
April 1, 2024
254482
Suriname
SUR
true
2
1
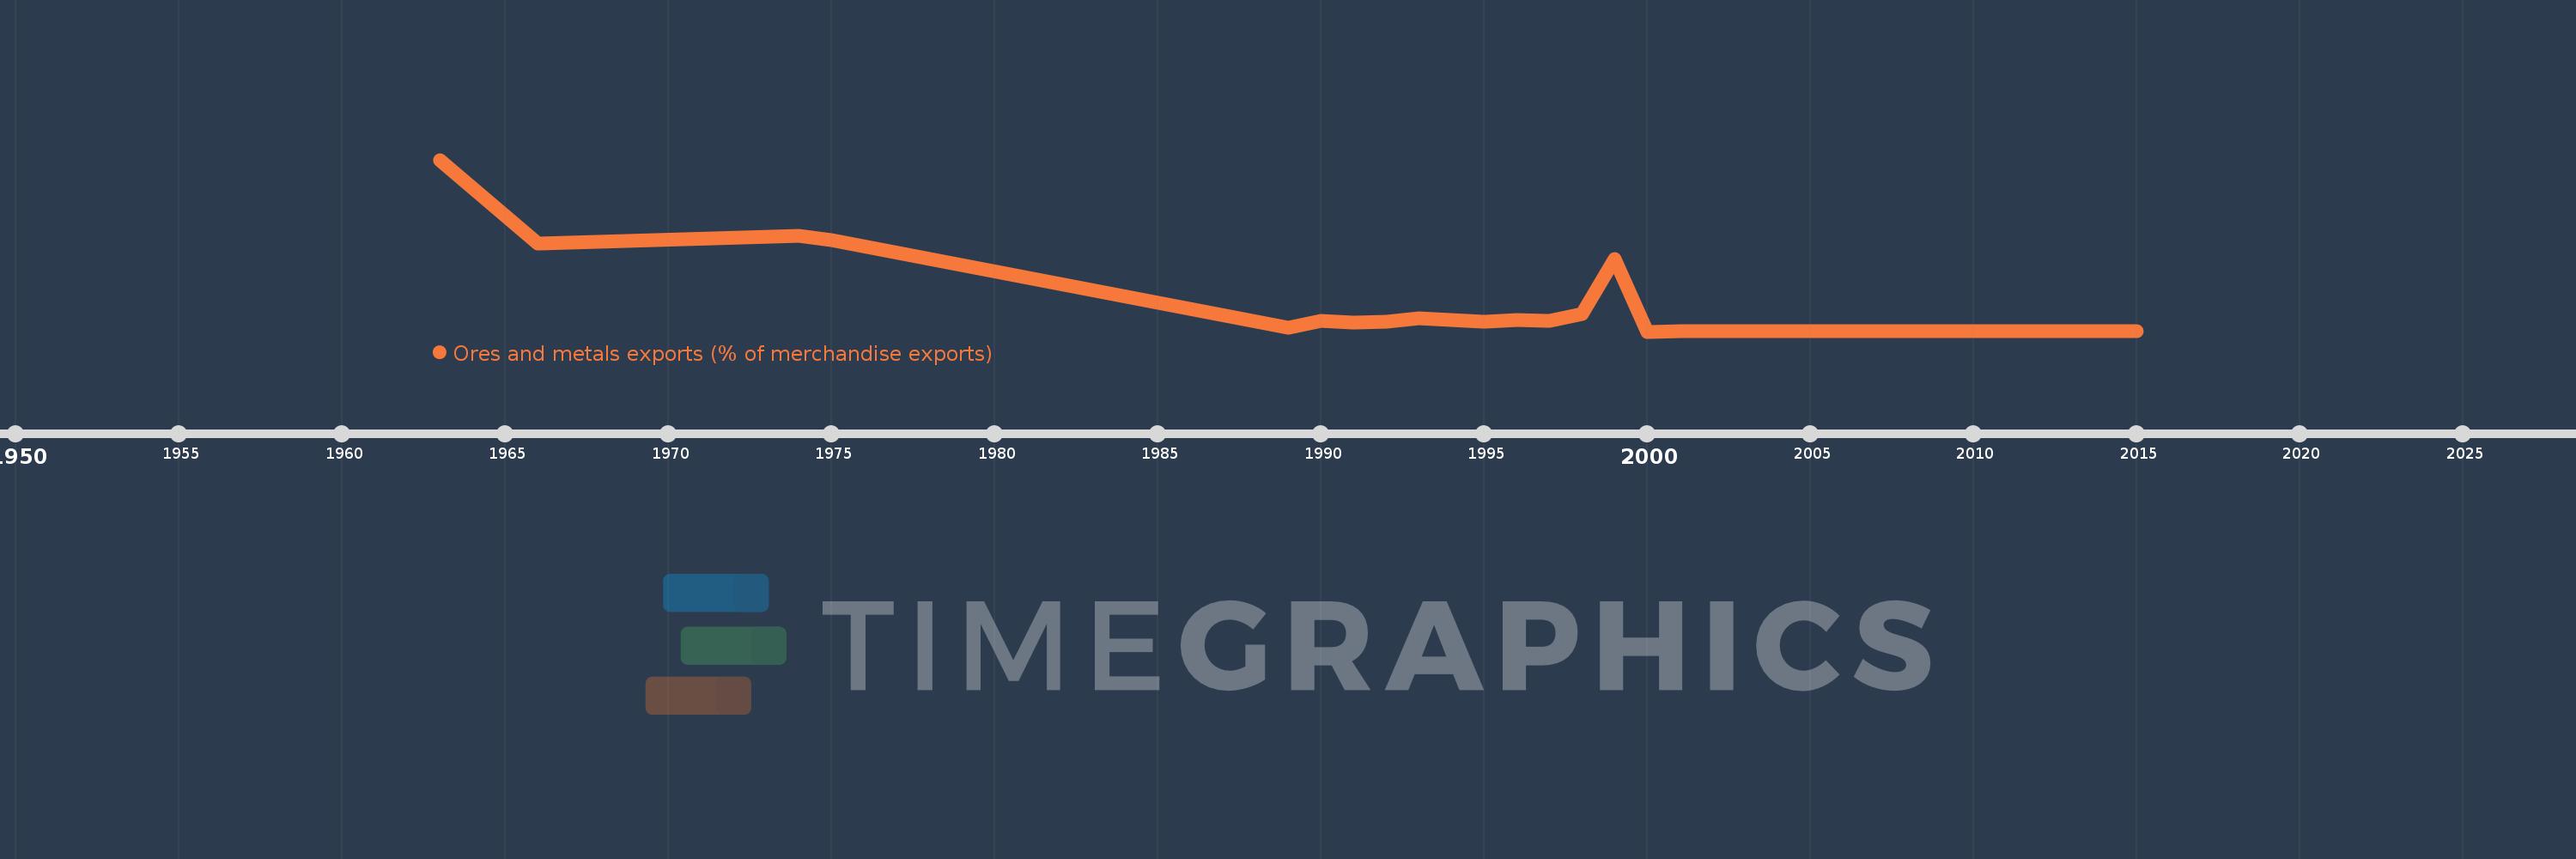
Ores and metals exports (% of merchandise exports)
2015,2014,2013,2012,2011,2010,2009,2008,2007,2006,2005,2004,2003,2002,2001,2000,1999,1998,1997,1996,1995,1993,1992,1991,1990,1989,1975,1974,1966,1963
This statistics in other country:
AfghanistanAlbaniaAlgeriaAndorraAngolaAntigua and BarbudaArab WorldArgentinaArmeniaArubaAustraliaAustriaAzerbaijanBahamas, TheBahrainBangladeshBarbadosBelarusBelgiumBelizeBeninBermudaBhutanBoliviaBosnia and HerzegovinaBotswanaBrazilBrunei DarussalamBulgariaBurkina FasoBurundiCabo VerdeCambodiaCameroonCanadaCaribbean small statesCayman IslandsCentral African RepublicCentral Europe and the BalticsChadChileChinaColombiaComorosCongo, Dem. Rep.Congo, Rep.Costa RicaCote d'IvoireCroatiaCubaCyprusCzech RepublicDenmarkDjiboutiDominicaDominican RepublicEarly-demographic dividendEast Asia & PacificEast Asia & Pacific (excluding high income)East Asia & Pacific (IDA & IBRD countries)EcuadorEgypt, Arab Rep.El SalvadorEquatorial GuineaEritreaEstoniaEthiopiaEuro areaEurope & Central AsiaEurope & Central Asia (excluding high income)Europe & Central Asia (IDA & IBRD countries)European UnionFaroe IslandsFijiFinlandFragile and conflict affected situationsFranceFrench PolynesiaGabonGambia, TheGeorgiaGermanyGhanaGreeceGreenlandGrenadaGuatemalaGuineaGuinea-BissauGuyanaHaitiHeavily indebted poor countries (HIPC)High incomeHondurasHong Kong SAR, ChinaHungaryIBRD onlyIcelandIDA & IBRD totalIDA blendIDA onlyIDA totalIndiaIndonesiaIran, Islamic Rep.IraqIrelandIsraelItalyJamaicaJapanJordanKazakhstanKenyaKiribatiKorea, Rep.KuwaitKyrgyz RepublicLao PDRLate-demographic dividendLatin America & Caribbean Latin America & Caribbean (excluding high income)Latin America & the Caribbean (IDA & IBRD countries)LatviaLeast developed countries: UN classificationLebanonLesothoLiberiaLibyaLithuaniaLow & middle incomeLower middle incomeLuxembourgMacao SAR, ChinaMacedonia, FYRMadagascarMalawiMalaysiaMaldivesMaliMaltaMauritaniaMauritiusMexicoMiddle East & North AfricaMiddle East & North Africa (excluding high income)Middle East & North Africa (IDA & IBRD countries)Middle incomeMoldovaMongoliaMoroccoMozambiqueMyanmarNamibiaNepalNetherlandsNew CaledoniaNew ZealandNicaraguaNigerNigeriaNorth AmericaNorwayOECD membersOmanOther small statesPacific island small statesPakistanPalauPanamaPapua New GuineaParaguayPeruPhilippinesPolandPortugalPost-demographic dividendPre-demographic dividendQatarRomaniaRussian FederationRwandaSamoaSao Tome and PrincipeSaudi ArabiaSenegalSerbiaSeychellesSierra LeoneSingaporeSlovak RepublicSloveniaSmall statesSolomon IslandsSomaliaSouth AfricaSouth AsiaSouth Asia (IDA & IBRD)SpainSri LankaSt. Kitts and NevisSt. LuciaSt. Vincent and the GrenadinesSub-Saharan Africa Sub-Saharan Africa (excluding high income)Sub-Saharan Africa (IDA & IBRD countries)SudanSurinameSwazilandSwedenSwitzerlandSyrian Arab RepublicTajikistanTanzaniaThailandTimor-LesteTogoTongaTrinidad and TobagoTunisiaTurkeyTurkmenistanTurks and Caicos IslandsUgandaUkraineUnited Arab EmiratesUnited KingdomUnited StatesUpper middle incomeUruguayVanuatuVenezuela, RBVietnamVirgin Islands (U.S.)WorldYemen, Rep.ZambiaZimbabwe Timeline:
This timeline shows a graph from 1963 to 2015 of Suriname. No data until 1962. Number of actual observations by date: 30.
Source name:
World Development Indicators
Source organization:
World Bank staff estimates from the Comtrade database maintained by the United Nations Statistics Division.
Categories, topics:
Energy & Mining, Private Sector, Trade
Last updated:
apr 23, 2017
Indicators value changes by year
Maximum:
157.888
jan 1, 1963
At the date of observation
Value
Absolute change
Change from previous value
jan 1, 1963
157.888
+157.888
0.0%
jan 1, 1966
80.62
-77.268
-48.94%
jan 1, 1974
87.874
+7.255
9.0%
jan 1, 1975
84.156
-3.718
-4.23%
jan 1, 1989
3.664
-80.492
-95.65%
jan 1, 1990
9.573
+5.909
161.29%
jan 1, 1991
8.239
-1.334
-13.93%
jan 1, 1992
8.955
+0.716
8.69%
jan 1, 1993
12.238
+3.283
36.66%
jan 1, 1995
8.948
-3.29
-26.88%
jan 1, 1996
10.938
+1.99
22.24%
jan 1, 1997
9.908
-1.03
-9.42%
jan 1, 1998
16.336
+6.428
64.88%
jan 1, 1999
66.493
+50.156
307.03%
jan 1, 2000
0.013
-66.48
-99.98%
jan 1, 2001
0.039
+0.026
202.96%
jan 1, 2002
0.044
+0.004
11.13%
jan 1, 2003
0.186
+0.143
328.19%
jan 1, 2004
0.101
-0.085
-45.69%
jan 1, 2005
0.181
+0.08
79.16%
jan 1, 2006
0.146
-0.035
-19.44%
jan 1, 2007
0.228
+0.082
55.8%
jan 1, 2008
0.35
+0.123
53.88%
jan 1, 2009
0.303
-0.047
-13.52%
jan 1, 2010
0.264
-0.039
-12.8%
jan 1, 2011
0.256
-0.008
-3.01%
jan 1, 2012
0.36
+0.104
40.58%
jan 1, 2013
0.431
+0.07
19.54%
jan 1, 2014
0.37
-0.061
-14.14%
jan 1, 2015
0.343
-0.026
-7.1%
Ranking of countries by current statistics by years


Comments: