29
/
en
AIzaSyAYiBZKx7MnpbEhh9jyipgxe19OcubqV5w
April 1, 2024
267232
Trinidad and Tobago
TTO
true
2
1
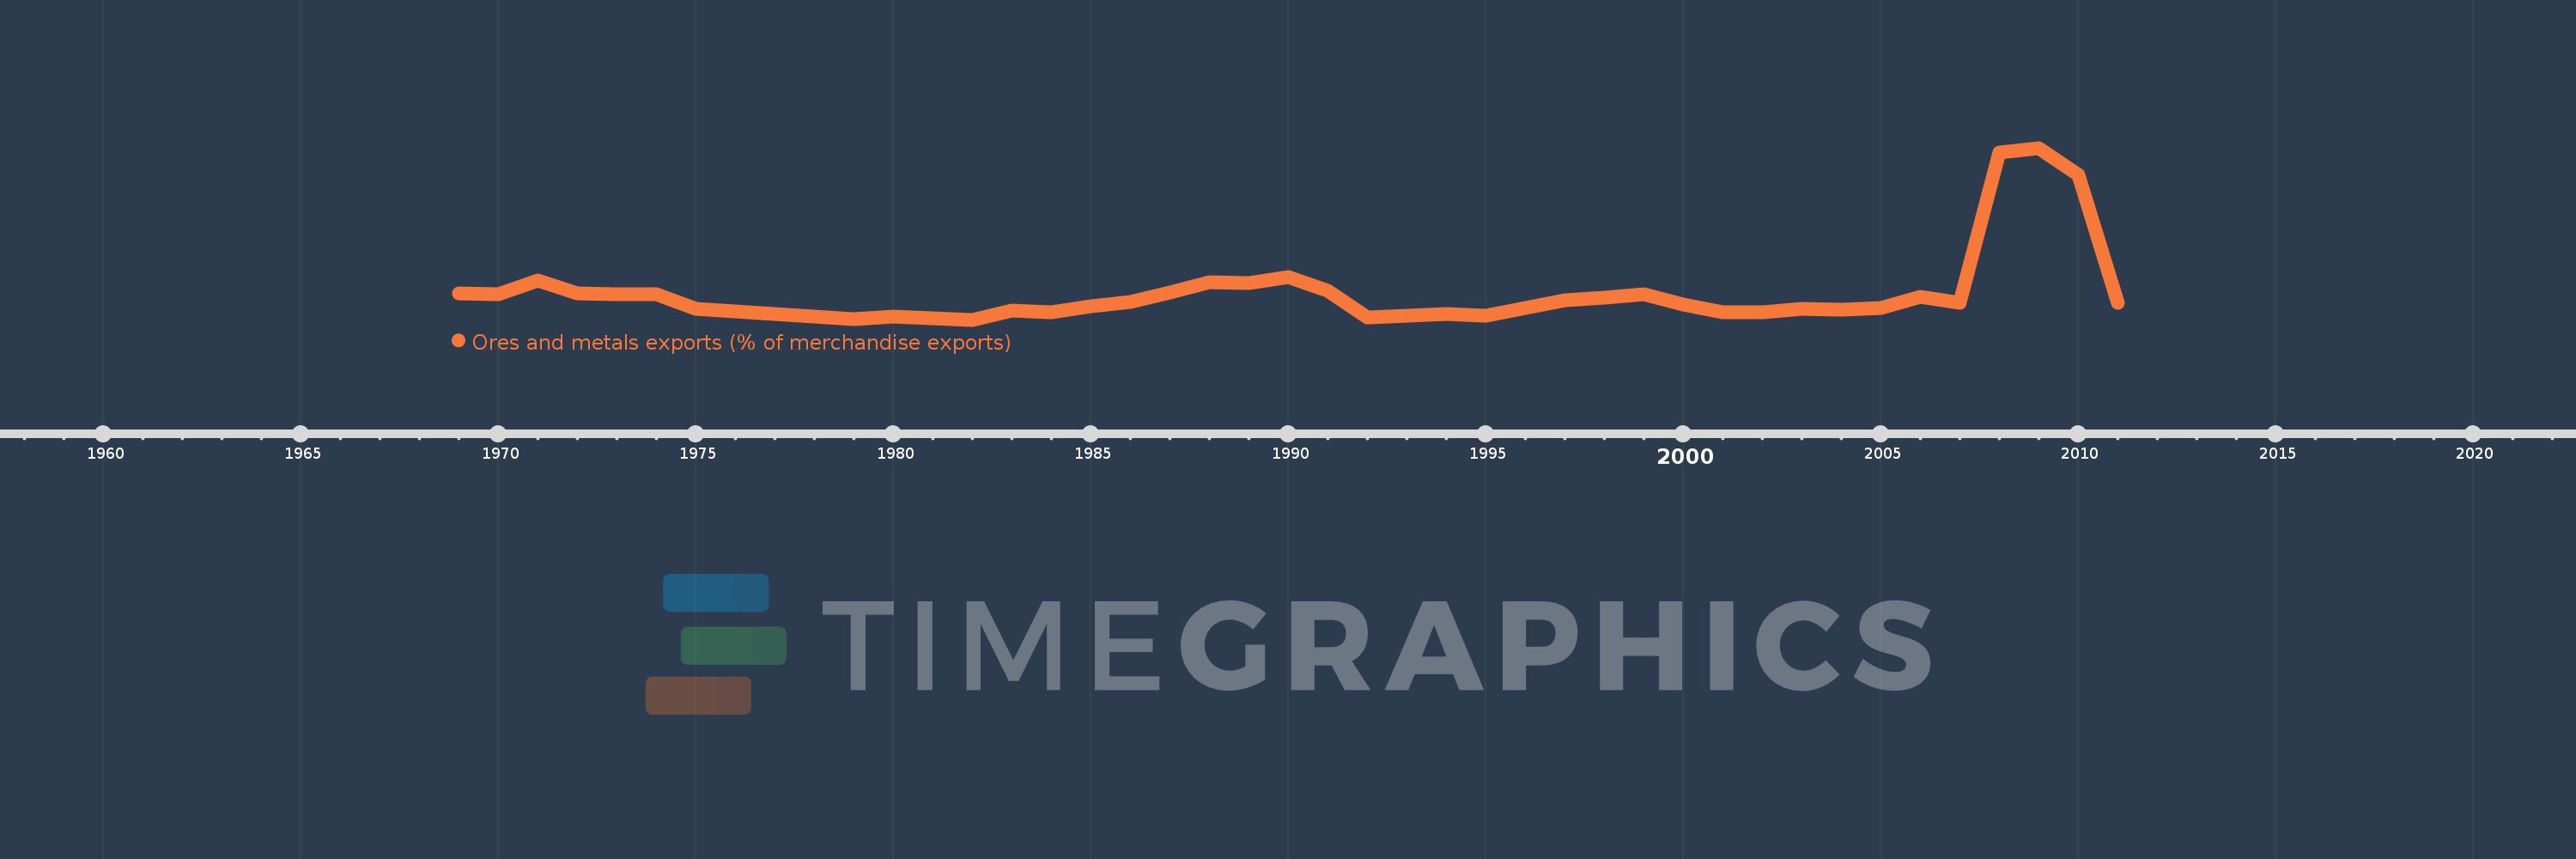
Ores and metals exports (% of merchandise exports)
2011,2010,2009,2008,2007,2006,2005,2004,2003,2002,2001,2000,1999,1998,1997,1996,1995,1994,1993,1992,1991,1990,1989,1988,1987,1986,1985,1984,1983,1982,1981,1980,1979,1978,1977,1976,1975,1974,1973,1972,1971,1970,1969
This statistics in other country:
AfghanistanAlbaniaAlgeriaAndorraAngolaAntigua and BarbudaArab WorldArgentinaArmeniaArubaAustraliaAustriaAzerbaijanBahamas, TheBahrainBangladeshBarbadosBelarusBelgiumBelizeBeninBermudaBhutanBoliviaBosnia and HerzegovinaBotswanaBrazilBrunei DarussalamBulgariaBurkina FasoBurundiCabo VerdeCambodiaCameroonCanadaCaribbean small statesCayman IslandsCentral African RepublicCentral Europe and the BalticsChadChileChinaColombiaComorosCongo, Dem. Rep.Congo, Rep.Costa RicaCote d'IvoireCroatiaCubaCyprusCzech RepublicDenmarkDjiboutiDominicaDominican RepublicEarly-demographic dividendEast Asia & PacificEast Asia & Pacific (excluding high income)East Asia & Pacific (IDA & IBRD countries)EcuadorEgypt, Arab Rep.El SalvadorEquatorial GuineaEritreaEstoniaEthiopiaEuro areaEurope & Central AsiaEurope & Central Asia (excluding high income)Europe & Central Asia (IDA & IBRD countries)European UnionFaroe IslandsFijiFinlandFragile and conflict affected situationsFranceFrench PolynesiaGabonGambia, TheGeorgiaGermanyGhanaGreeceGreenlandGrenadaGuatemalaGuineaGuinea-BissauGuyanaHaitiHeavily indebted poor countries (HIPC)High incomeHondurasHong Kong SAR, ChinaHungaryIBRD onlyIcelandIDA & IBRD totalIDA blendIDA onlyIDA totalIndiaIndonesiaIran, Islamic Rep.IraqIrelandIsraelItalyJamaicaJapanJordanKazakhstanKenyaKiribatiKorea, Rep.KuwaitKyrgyz RepublicLao PDRLate-demographic dividendLatin America & Caribbean Latin America & Caribbean (excluding high income)Latin America & the Caribbean (IDA & IBRD countries)LatviaLeast developed countries: UN classificationLebanonLesothoLiberiaLibyaLithuaniaLow & middle incomeLower middle incomeLuxembourgMacao SAR, ChinaMacedonia, FYRMadagascarMalawiMalaysiaMaldivesMaliMaltaMauritaniaMauritiusMexicoMiddle East & North AfricaMiddle East & North Africa (excluding high income)Middle East & North Africa (IDA & IBRD countries)Middle incomeMoldovaMongoliaMoroccoMozambiqueMyanmarNamibiaNepalNetherlandsNew CaledoniaNew ZealandNicaraguaNigerNigeriaNorth AmericaNorwayOECD membersOmanOther small statesPacific island small statesPakistanPalauPanamaPapua New GuineaParaguayPeruPhilippinesPolandPortugalPost-demographic dividendPre-demographic dividendQatarRomaniaRussian FederationRwandaSamoaSao Tome and PrincipeSaudi ArabiaSenegalSerbiaSeychellesSierra LeoneSingaporeSlovak RepublicSloveniaSmall statesSolomon IslandsSomaliaSouth AfricaSouth AsiaSouth Asia (IDA & IBRD)SpainSri LankaSt. Kitts and NevisSt. LuciaSt. Vincent and the GrenadinesSub-Saharan Africa Sub-Saharan Africa (excluding high income)Sub-Saharan Africa (IDA & IBRD countries)SudanSurinameSwazilandSwedenSwitzerlandSyrian Arab RepublicTajikistanTanzaniaThailandTimor-LesteTogoTongaTrinidad and TobagoTunisiaTurkeyTurkmenistanTurks and Caicos IslandsUgandaUkraineUnited Arab EmiratesUnited KingdomUnited StatesUpper middle incomeUruguayVanuatuVenezuela, RBVietnamVirgin Islands (U.S.)WorldYemen, Rep.ZambiaZimbabwe Timeline:
This timeline shows a graph from 1969 to 2011 of Trinidad and Tobago. No data until 1968. Number of actual observations by date: 43.
Source name:
World Development Indicators
Source organization:
World Bank staff estimates from the Comtrade database maintained by the United Nations Statistics Division.
Categories, topics:
Energy & Mining, Private Sector, Trade
Last updated:
apr 23, 2017
Indicators value changes by year
At the date of observation
Value
Absolute change
Change from previous value
jan 1, 1969
0.468
+0.468
0.0%
jan 1, 1970
0.461
-0.007
-1.52%
jan 1, 1971
0.692
+0.231
50.2%
jan 1, 1972
0.469
-0.223
-32.26%
jan 1, 1973
0.454
-0.015
-3.12%
jan 1, 1974
0.458
+0.004
0.84%
jan 1, 1975
0.207
-0.251
-54.73%
jan 1, 1976
0.173
-0.034
-16.45%
jan 1, 1977
0.121
-0.052
-29.98%
jan 1, 1978
0.085
-0.036
-29.74%
jan 1, 1979
0.037
-0.048
-56.73%
jan 1, 1980
0.073
+0.036
98.79%
jan 1, 1981
0.055
-0.019
-25.56%
jan 1, 1982
0.026
-0.029
-53.06%
jan 1, 1983
0.184
+0.158
618.1%
jan 1, 1984
0.155
-0.029
-15.97%
jan 1, 1985
0.249
+0.095
61.35%
jan 1, 1986
0.325
+0.076
30.45%
jan 1, 1987
0.484
+0.159
48.92%
jan 1, 1988
0.662
+0.178
36.73%
jan 1, 1989
0.645
-0.017
-2.56%
jan 1, 1990
0.746
+0.1
15.57%
jan 1, 1991
0.52
-0.226
-30.25%
jan 1, 1992
0.066
-0.454
-87.37%
jan 1, 1993
0.091
+0.025
38.43%
jan 1, 1994
0.118
+0.027
29.51%
jan 1, 1995
0.093
-0.025
-21.09%
jan 1, 1996
0.221
+0.128
137.77%
jan 1, 1997
0.352
+0.131
59.1%
jan 1, 1998
0.401
+0.049
13.95%
jan 1, 1999
0.461
+0.061
15.17%
jan 1, 2000
0.279
-0.183
-39.63%
jan 1, 2001
0.147
-0.132
-47.34%
jan 1, 2002
0.151
+0.004
2.75%
jan 1, 2003
0.207
+0.056
37.04%
jan 1, 2004
0.191
-0.016
-7.55%
jan 1, 2005
0.228
+0.038
19.65%
jan 1, 2006
0.418
+0.19
83.04%
jan 1, 2007
0.318
-0.1
-23.85%
jan 1, 2008
2.844
+2.525
793.11%
jan 1, 2009
2.928
+0.085
2.98%
jan 1, 2010
2.476
-0.453
-15.46%
jan 1, 2011
0.309
-2.167
-87.52%
Ranking of countries by current statistics by years


Comments: