29
/
en
AIzaSyAYiBZKx7MnpbEhh9jyipgxe19OcubqV5w
April 1, 2024
139607
Germany
DEU
true
2
1
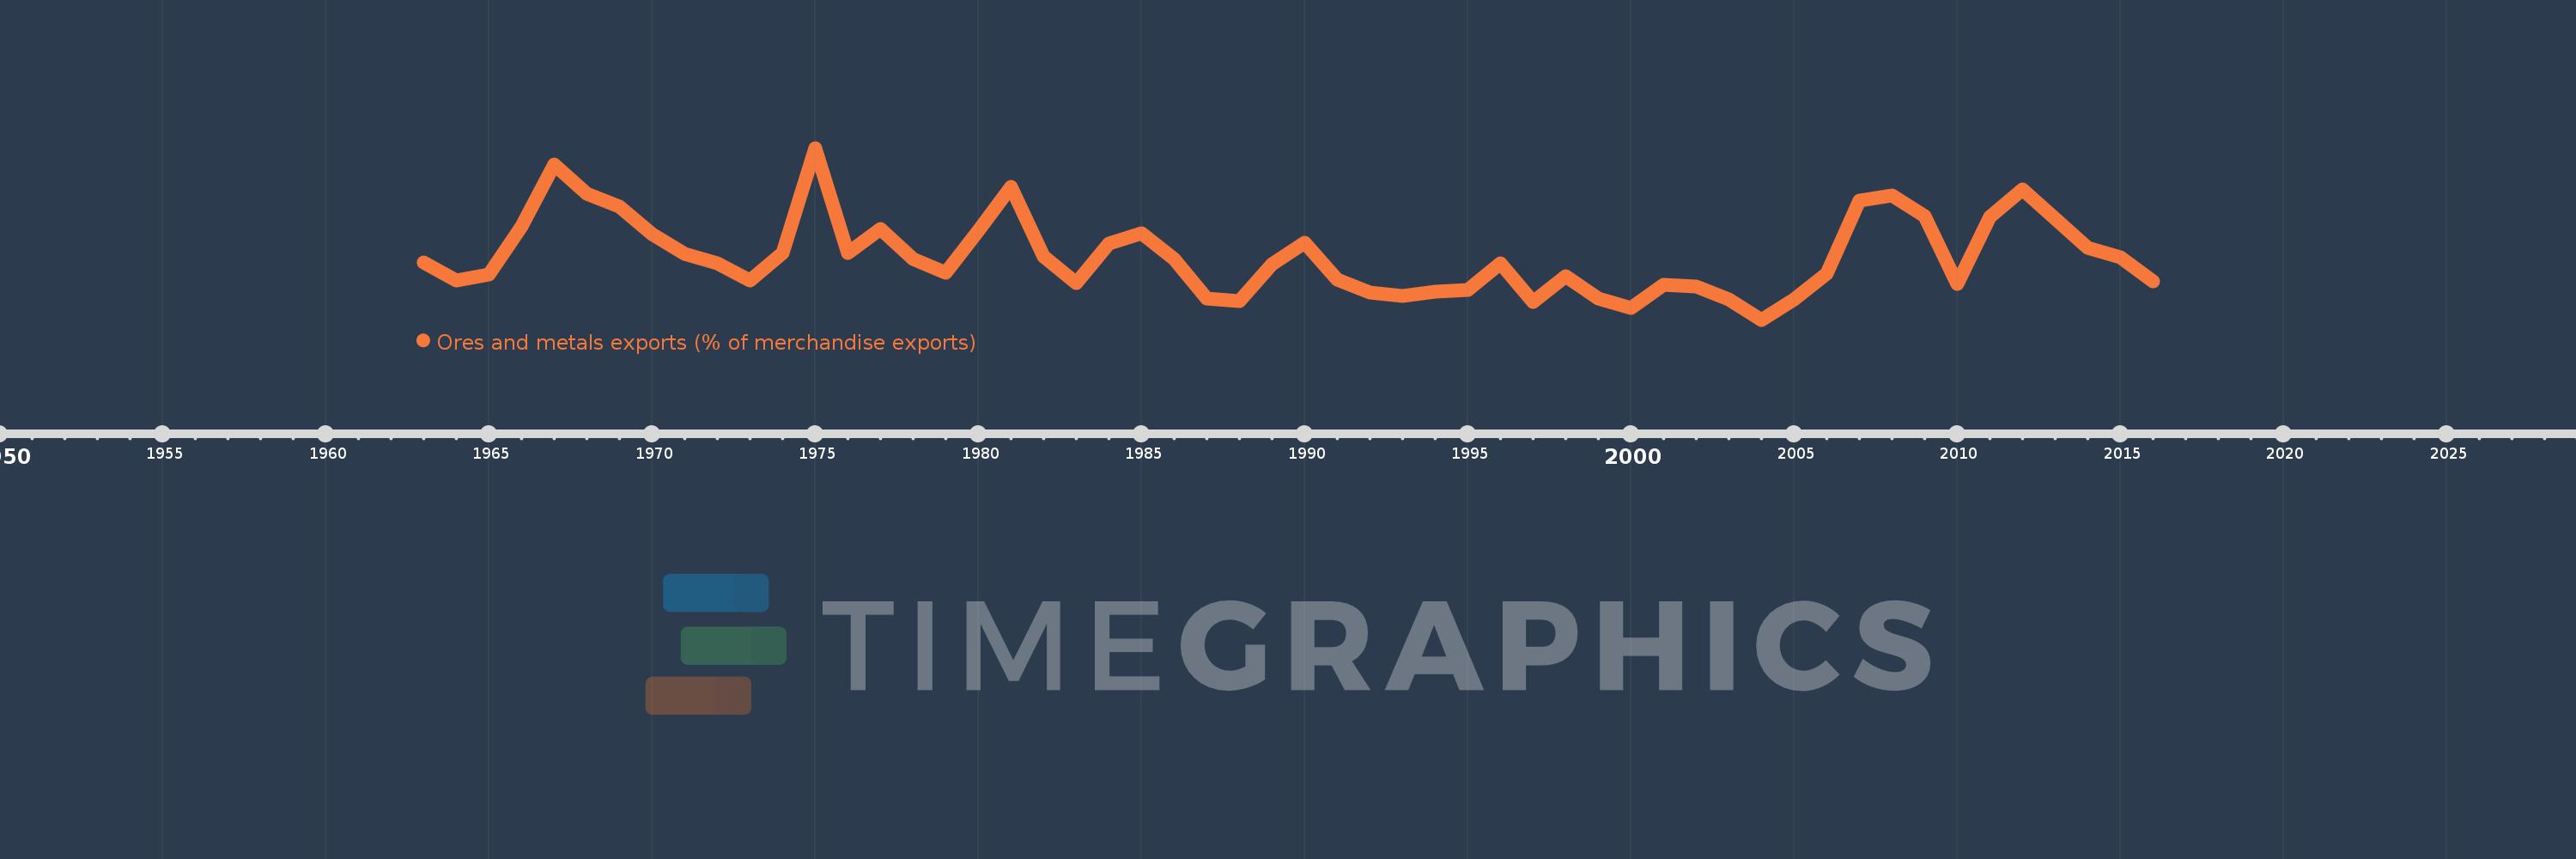
Ores and metals exports (% of merchandise exports)
2016,2015,2014,2013,2012,2011,2010,2009,2008,2007,2006,2005,2004,2003,2002,2001,2000,1999,1998,1997,1996,1995,1994,1993,1992,1991,1990,1989,1988,1987,1986,1985,1984,1983,1982,1981,1980,1979,1978,1977,1976,1975,1974,1973,1972,1971,1970,1969,1968,1967,1966,1965,1964,1963
This statistics in other country:
AfghanistanAlbaniaAlgeriaAndorraAngolaAntigua and BarbudaArab WorldArgentinaArmeniaArubaAustraliaAustriaAzerbaijanBahamas, TheBahrainBangladeshBarbadosBelarusBelgiumBelizeBeninBermudaBhutanBoliviaBosnia and HerzegovinaBotswanaBrazilBrunei DarussalamBulgariaBurkina FasoBurundiCabo VerdeCambodiaCameroonCanadaCaribbean small statesCayman IslandsCentral African RepublicCentral Europe and the BalticsChadChileChinaColombiaComorosCongo, Dem. Rep.Congo, Rep.Costa RicaCote d'IvoireCroatiaCubaCyprusCzech RepublicDenmarkDjiboutiDominicaDominican RepublicEarly-demographic dividendEast Asia & PacificEast Asia & Pacific (excluding high income)East Asia & Pacific (IDA & IBRD countries)EcuadorEgypt, Arab Rep.El SalvadorEquatorial GuineaEritreaEstoniaEthiopiaEuro areaEurope & Central AsiaEurope & Central Asia (excluding high income)Europe & Central Asia (IDA & IBRD countries)European UnionFaroe IslandsFijiFinlandFragile and conflict affected situationsFranceFrench PolynesiaGabonGambia, TheGeorgiaGermanyGhanaGreeceGreenlandGrenadaGuatemalaGuineaGuinea-BissauGuyanaHaitiHeavily indebted poor countries (HIPC)High incomeHondurasHong Kong SAR, ChinaHungaryIBRD onlyIcelandIDA & IBRD totalIDA blendIDA onlyIDA totalIndiaIndonesiaIran, Islamic Rep.IraqIrelandIsraelItalyJamaicaJapanJordanKazakhstanKenyaKiribatiKorea, Rep.KuwaitKyrgyz RepublicLao PDRLate-demographic dividendLatin America & Caribbean Latin America & Caribbean (excluding high income)Latin America & the Caribbean (IDA & IBRD countries)LatviaLeast developed countries: UN classificationLebanonLesothoLiberiaLibyaLithuaniaLow & middle incomeLower middle incomeLuxembourgMacao SAR, ChinaMacedonia, FYRMadagascarMalawiMalaysiaMaldivesMaliMaltaMauritaniaMauritiusMexicoMiddle East & North AfricaMiddle East & North Africa (excluding high income)Middle East & North Africa (IDA & IBRD countries)Middle incomeMoldovaMongoliaMoroccoMozambiqueMyanmarNamibiaNepalNetherlandsNew CaledoniaNew ZealandNicaraguaNigerNigeriaNorth AmericaNorwayOECD membersOmanOther small statesPacific island small statesPakistanPalauPanamaPapua New GuineaParaguayPeruPhilippinesPolandPortugalPost-demographic dividendPre-demographic dividendQatarRomaniaRussian FederationRwandaSamoaSao Tome and PrincipeSaudi ArabiaSenegalSerbiaSeychellesSierra LeoneSingaporeSlovak RepublicSloveniaSmall statesSolomon IslandsSomaliaSouth AfricaSouth AsiaSouth Asia (IDA & IBRD)SpainSri LankaSt. Kitts and NevisSt. LuciaSt. Vincent and the GrenadinesSub-Saharan Africa Sub-Saharan Africa (excluding high income)Sub-Saharan Africa (IDA & IBRD countries)SudanSurinameSwazilandSwedenSwitzerlandSyrian Arab RepublicTajikistanTanzaniaThailandTimor-LesteTogoTongaTrinidad and TobagoTunisiaTurkeyTurkmenistanTurks and Caicos IslandsUgandaUkraineUnited Arab EmiratesUnited KingdomUnited StatesUpper middle incomeUruguayVanuatuVenezuela, RBVietnamVirgin Islands (U.S.)WorldYemen, Rep.ZambiaZimbabwe Timeline:
This timeline shows a graph from 1963 to 2016 of Germany. No data until 1962. Number of actual observations by date: 54.
Source name:
World Development Indicators
Source organization:
World Bank staff estimates from the Comtrade database maintained by the United Nations Statistics Division.
Categories, topics:
Energy & Mining, Private Sector, Trade
Last updated:
apr 23, 2017
Indicators value changes by year
At the date of observation
Value
Absolute change
Change from previous value
jan 1, 1963
2.68
+2.68
0.0%
jan 1, 1964
2.506
-0.174
-6.49%
jan 1, 1965
2.56
+0.054
2.14%
jan 1, 1966
3.013
+0.453
17.7%
jan 1, 1967
3.599
+0.586
19.46%
jan 1, 1968
3.322
-0.277
-7.69%
jan 1, 1969
3.2
-0.122
-3.68%
jan 1, 1970
2.947
-0.253
-7.92%
jan 1, 1971
2.758
-0.189
-6.41%
jan 1, 1972
2.666
-0.092
-3.34%
jan 1, 1973
2.507
-0.159
-5.96%
jan 1, 1974
2.765
+0.258
10.3%
jan 1, 1975
3.756
+0.991
35.83%
jan 1, 1976
2.763
-0.993
-26.44%
jan 1, 1977
2.995
+0.232
8.38%
jan 1, 1978
2.706
-0.289
-9.64%
jan 1, 1979
2.582
-0.124
-4.58%
jan 1, 1980
2.979
+0.397
15.39%
jan 1, 1981
3.387
+0.408
13.7%
jan 1, 1982
2.729
-0.658
-19.43%
jan 1, 1983
2.483
-0.246
-9.01%
jan 1, 1984
2.851
+0.368
14.8%
jan 1, 1985
2.95
+0.099
3.48%
jan 1, 1986
2.708
-0.242
-8.21%
jan 1, 1987
2.339
-0.369
-13.63%
jan 1, 1988
2.309
-0.03
-1.27%
jan 1, 1989
2.658
+0.349
15.12%
jan 1, 1990
2.865
+0.207
7.79%
jan 1, 1991
2.518
-0.347
-12.12%
jan 1, 1992
2.389
-0.129
-5.13%
jan 1, 1993
2.357
-0.031
-1.31%
jan 1, 1994
2.403
+0.045
1.92%
jan 1, 1995
2.416
+0.014
0.57%
jan 1, 1996
2.67
+0.253
10.49%
jan 1, 1997
2.307
-0.363
-13.6%
jan 1, 1998
2.548
+0.241
10.47%
jan 1, 1999
2.34
-0.208
-8.18%
jan 1, 2000
2.244
-0.095
-4.08%
jan 1, 2001
2.467
+0.222
9.91%
jan 1, 2002
2.448
-0.018
-0.75%
jan 1, 2003
2.33
-0.119
-4.84%
jan 1, 2004
2.136
-0.194
-8.31%
jan 1, 2005
2.328
+0.192
8.99%
jan 1, 2006
2.572
+0.244
10.46%
jan 1, 2007
3.263
+0.691
26.86%
jan 1, 2008
3.305
+0.042
1.29%
jan 1, 2009
3.116
-0.189
-5.72%
jan 1, 2010
2.475
-0.641
-20.56%
jan 1, 2011
3.103
+0.628
25.37%
jan 1, 2012
3.367
+0.264
8.51%
jan 1, 2013
3.092
-0.275
-8.17%
jan 1, 2014
2.811
-0.281
-9.09%
jan 1, 2015
2.724
-0.087
-3.09%
jan 1, 2016
2.502
-0.222
-8.16%
Ranking of countries by current statistics by years


Comments: