29
/
en
AIzaSyAYiBZKx7MnpbEhh9jyipgxe19OcubqV5w
April 1, 2024
236215
Senegal
SEN
true
2
1
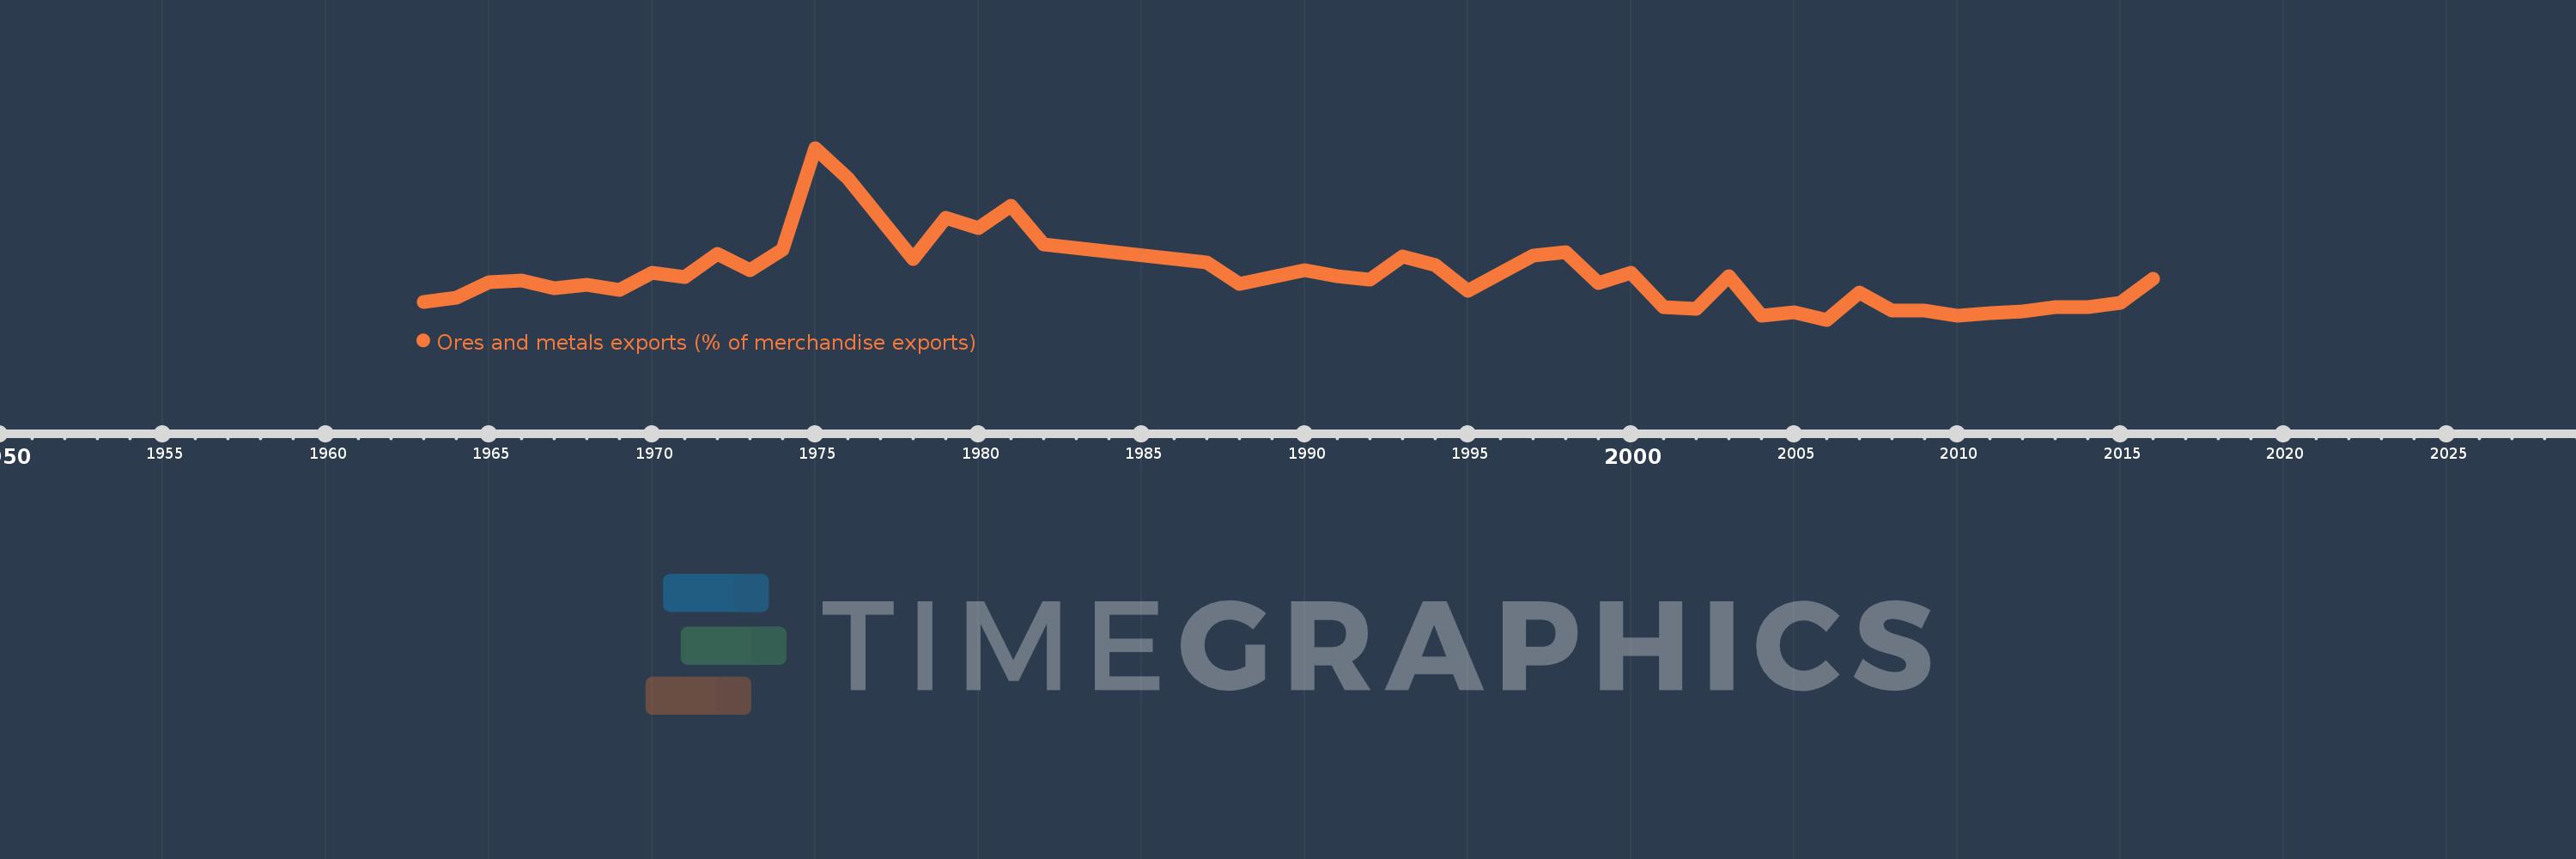
Ores and metals exports (% of merchandise exports)
2016,2015,2014,2013,2012,2011,2010,2009,2008,2007,2006,2005,2004,2003,2002,2001,2000,1999,1998,1997,1995,1994,1993,1992,1991,1990,1988,1987,1982,1981,1980,1979,1978,1976,1975,1974,1973,1972,1971,1970,1969,1968,1967,1966,1965,1964,1963
This statistics in other country:
AfghanistanAlbaniaAlgeriaAndorraAngolaAntigua and BarbudaArab WorldArgentinaArmeniaArubaAustraliaAustriaAzerbaijanBahamas, TheBahrainBangladeshBarbadosBelarusBelgiumBelizeBeninBermudaBhutanBoliviaBosnia and HerzegovinaBotswanaBrazilBrunei DarussalamBulgariaBurkina FasoBurundiCabo VerdeCambodiaCameroonCanadaCaribbean small statesCayman IslandsCentral African RepublicCentral Europe and the BalticsChadChileChinaColombiaComorosCongo, Dem. Rep.Congo, Rep.Costa RicaCote d'IvoireCroatiaCubaCyprusCzech RepublicDenmarkDjiboutiDominicaDominican RepublicEarly-demographic dividendEast Asia & PacificEast Asia & Pacific (excluding high income)East Asia & Pacific (IDA & IBRD countries)EcuadorEgypt, Arab Rep.El SalvadorEquatorial GuineaEritreaEstoniaEthiopiaEuro areaEurope & Central AsiaEurope & Central Asia (excluding high income)Europe & Central Asia (IDA & IBRD countries)European UnionFaroe IslandsFijiFinlandFragile and conflict affected situationsFranceFrench PolynesiaGabonGambia, TheGeorgiaGermanyGhanaGreeceGreenlandGrenadaGuatemalaGuineaGuinea-BissauGuyanaHaitiHeavily indebted poor countries (HIPC)High incomeHondurasHong Kong SAR, ChinaHungaryIBRD onlyIcelandIDA & IBRD totalIDA blendIDA onlyIDA totalIndiaIndonesiaIran, Islamic Rep.IraqIrelandIsraelItalyJamaicaJapanJordanKazakhstanKenyaKiribatiKorea, Rep.KuwaitKyrgyz RepublicLao PDRLate-demographic dividendLatin America & Caribbean Latin America & Caribbean (excluding high income)Latin America & the Caribbean (IDA & IBRD countries)LatviaLeast developed countries: UN classificationLebanonLesothoLiberiaLibyaLithuaniaLow & middle incomeLower middle incomeLuxembourgMacao SAR, ChinaMacedonia, FYRMadagascarMalawiMalaysiaMaldivesMaliMaltaMauritaniaMauritiusMexicoMiddle East & North AfricaMiddle East & North Africa (excluding high income)Middle East & North Africa (IDA & IBRD countries)Middle incomeMoldovaMongoliaMoroccoMozambiqueMyanmarNamibiaNepalNetherlandsNew CaledoniaNew ZealandNicaraguaNigerNigeriaNorth AmericaNorwayOECD membersOmanOther small statesPacific island small statesPakistanPalauPanamaPapua New GuineaParaguayPeruPhilippinesPolandPortugalPost-demographic dividendPre-demographic dividendQatarRomaniaRussian FederationRwandaSamoaSao Tome and PrincipeSaudi ArabiaSenegalSerbiaSeychellesSierra LeoneSingaporeSlovak RepublicSloveniaSmall statesSolomon IslandsSomaliaSouth AfricaSouth AsiaSouth Asia (IDA & IBRD)SpainSri LankaSt. Kitts and NevisSt. LuciaSt. Vincent and the GrenadinesSub-Saharan Africa Sub-Saharan Africa (excluding high income)Sub-Saharan Africa (IDA & IBRD countries)SudanSurinameSwazilandSwedenSwitzerlandSyrian Arab RepublicTajikistanTanzaniaThailandTimor-LesteTogoTongaTrinidad and TobagoTunisiaTurkeyTurkmenistanTurks and Caicos IslandsUgandaUkraineUnited Arab EmiratesUnited KingdomUnited StatesUpper middle incomeUruguayVanuatuVenezuela, RBVietnamVirgin Islands (U.S.)WorldYemen, Rep.ZambiaZimbabwe Timeline:
This timeline shows a graph from 1963 to 2016 of Senegal. No data until 1962. Number of actual observations by date: 47.
Source name:
World Development Indicators
Source organization:
World Bank staff estimates from the Comtrade database maintained by the United Nations Statistics Division.
Categories, topics:
Energy & Mining, Private Sector, Trade
Last updated:
apr 23, 2017
Indicators value changes by year
Maximum:
28.618
jan 1, 1975
At the date of observation
Value
Absolute change
Change from previous value
jan 1, 1963
5.521
+5.521
0.0%
jan 1, 1964
6.186
+0.666
12.06%
jan 1, 1965
8.447
+2.26
36.53%
jan 1, 1966
8.658
+0.211
2.5%
jan 1, 1967
7.575
-1.083
-12.51%
jan 1, 1968
8.023
+0.448
5.92%
jan 1, 1969
7.302
-0.722
-9.0%
jan 1, 1970
9.874
+2.572
35.22%
jan 1, 1971
9.283
-0.591
-5.98%
jan 1, 1972
12.74
+3.458
37.25%
jan 1, 1973
10.249
-2.491
-19.55%
jan 1, 1974
13.407
+3.159
30.82%
jan 1, 1975
28.618
+15.211
113.45%
jan 1, 1976
24.016
-4.602
-16.08%
jan 1, 1978
11.949
-12.067
-50.24%
jan 1, 1979
18.076
+6.127
51.27%
jan 1, 1980
16.59
-1.486
-8.22%
jan 1, 1981
19.975
+3.385
20.4%
jan 1, 1982
14.13
-5.845
-29.26%
jan 1, 1987
11.394
-2.736
-19.36%
jan 1, 1988
8.215
-3.179
-27.9%
jan 1, 1990
10.238
+2.023
24.63%
jan 1, 1991
9.324
-0.914
-8.93%
jan 1, 1992
8.885
-0.439
-4.71%
jan 1, 1993
12.354
+3.47
39.05%
jan 1, 1994
11.031
-1.324
-10.72%
jan 1, 1995
7.204
-3.826
-34.69%
jan 1, 1997
12.469
+5.264
73.07%
jan 1, 1998
12.997
+0.529
4.24%
jan 1, 1999
8.293
-4.705
-36.2%
jan 1, 2000
9.828
+1.535
18.51%
jan 1, 2001
4.752
-5.075
-51.64%
jan 1, 2002
4.484
-0.269
-5.66%
jan 1, 2003
9.395
+4.912
109.55%
jan 1, 2004
3.367
-6.028
-64.16%
jan 1, 2005
3.87
+0.503
14.93%
jan 1, 2006
2.808
-1.062
-27.44%
jan 1, 2007
6.93
+4.122
146.8%
jan 1, 2008
4.133
-2.797
-40.37%
jan 1, 2009
4.251
+0.118
2.86%
jan 1, 2010
3.374
-0.877
-20.62%
jan 1, 2011
3.764
+0.39
11.55%
jan 1, 2012
4.11
+0.345
9.17%
jan 1, 2013
4.765
+0.656
15.96%
jan 1, 2014
4.75
-0.015
-0.32%
jan 1, 2015
5.29
+0.54
11.37%
jan 1, 2016
9.011
+3.72
70.32%
Ranking of countries by current statistics by years


Comments: