29
/
en
AIzaSyAYiBZKx7MnpbEhh9jyipgxe19OcubqV5w
April 1, 2024
188227
Malaysia
MYS
true
2
1
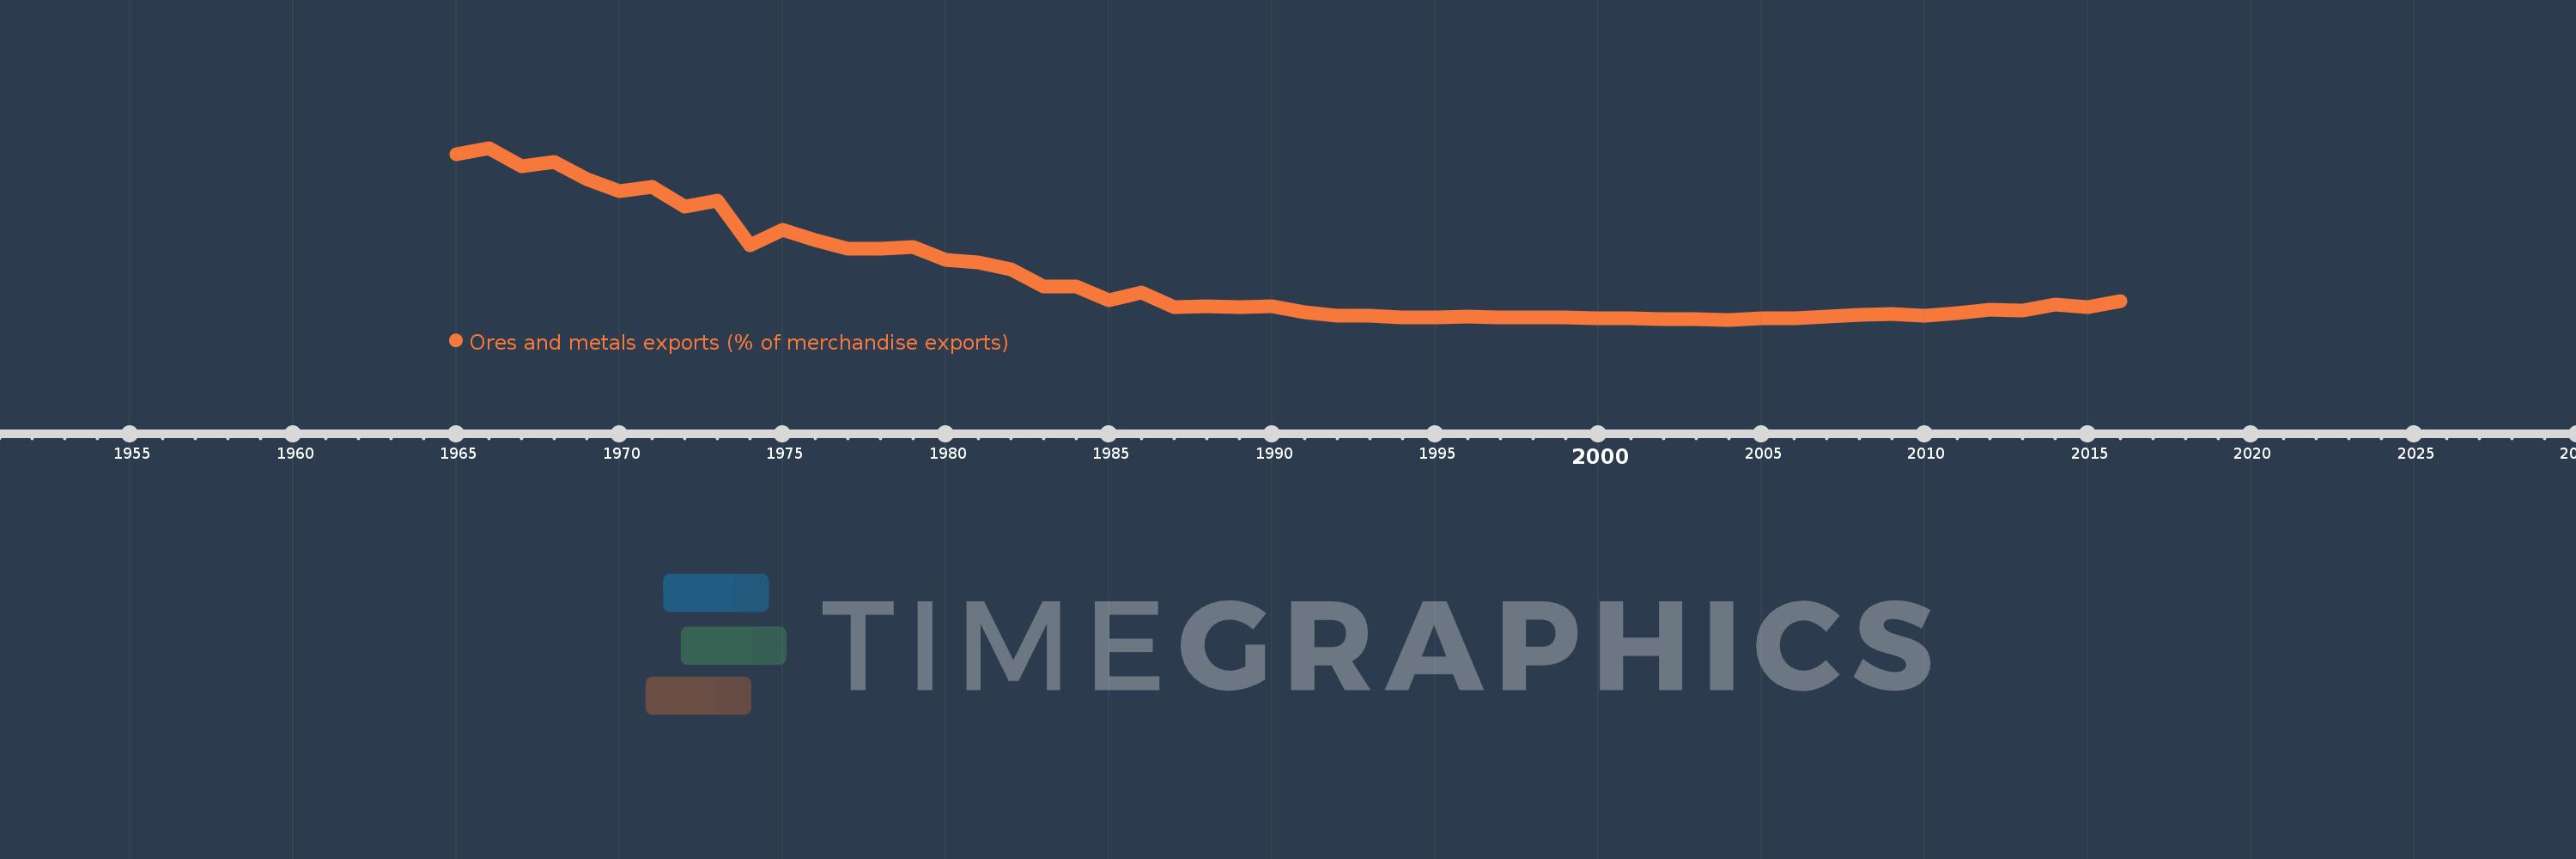
Ores and metals exports (% of merchandise exports)
2016,2015,2014,2013,2012,2011,2010,2009,2008,2007,2006,2005,2004,2003,2002,2001,2000,1999,1998,1997,1996,1995,1994,1993,1992,1991,1990,1989,1988,1987,1986,1985,1984,1983,1982,1981,1980,1979,1978,1977,1976,1975,1974,1973,1972,1971,1970,1969,1968,1967,1966,1965
This statistics in other country:
AfghanistanAlbaniaAlgeriaAndorraAngolaAntigua and BarbudaArab WorldArgentinaArmeniaArubaAustraliaAustriaAzerbaijanBahamas, TheBahrainBangladeshBarbadosBelarusBelgiumBelizeBeninBermudaBhutanBoliviaBosnia and HerzegovinaBotswanaBrazilBrunei DarussalamBulgariaBurkina FasoBurundiCabo VerdeCambodiaCameroonCanadaCaribbean small statesCayman IslandsCentral African RepublicCentral Europe and the BalticsChadChileChinaColombiaComorosCongo, Dem. Rep.Congo, Rep.Costa RicaCote d'IvoireCroatiaCubaCyprusCzech RepublicDenmarkDjiboutiDominicaDominican RepublicEarly-demographic dividendEast Asia & PacificEast Asia & Pacific (excluding high income)East Asia & Pacific (IDA & IBRD countries)EcuadorEgypt, Arab Rep.El SalvadorEquatorial GuineaEritreaEstoniaEthiopiaEuro areaEurope & Central AsiaEurope & Central Asia (excluding high income)Europe & Central Asia (IDA & IBRD countries)European UnionFaroe IslandsFijiFinlandFragile and conflict affected situationsFranceFrench PolynesiaGabonGambia, TheGeorgiaGermanyGhanaGreeceGreenlandGrenadaGuatemalaGuineaGuinea-BissauGuyanaHaitiHeavily indebted poor countries (HIPC)High incomeHondurasHong Kong SAR, ChinaHungaryIBRD onlyIcelandIDA & IBRD totalIDA blendIDA onlyIDA totalIndiaIndonesiaIran, Islamic Rep.IraqIrelandIsraelItalyJamaicaJapanJordanKazakhstanKenyaKiribatiKorea, Rep.KuwaitKyrgyz RepublicLao PDRLate-demographic dividendLatin America & Caribbean Latin America & Caribbean (excluding high income)Latin America & the Caribbean (IDA & IBRD countries)LatviaLeast developed countries: UN classificationLebanonLesothoLiberiaLibyaLithuaniaLow & middle incomeLower middle incomeLuxembourgMacao SAR, ChinaMacedonia, FYRMadagascarMalawiMalaysiaMaldivesMaliMaltaMauritaniaMauritiusMexicoMiddle East & North AfricaMiddle East & North Africa (excluding high income)Middle East & North Africa (IDA & IBRD countries)Middle incomeMoldovaMongoliaMoroccoMozambiqueMyanmarNamibiaNepalNetherlandsNew CaledoniaNew ZealandNicaraguaNigerNigeriaNorth AmericaNorwayOECD membersOmanOther small statesPacific island small statesPakistanPalauPanamaPapua New GuineaParaguayPeruPhilippinesPolandPortugalPost-demographic dividendPre-demographic dividendQatarRomaniaRussian FederationRwandaSamoaSao Tome and PrincipeSaudi ArabiaSenegalSerbiaSeychellesSierra LeoneSingaporeSlovak RepublicSloveniaSmall statesSolomon IslandsSomaliaSouth AfricaSouth AsiaSouth Asia (IDA & IBRD)SpainSri LankaSt. Kitts and NevisSt. LuciaSt. Vincent and the GrenadinesSub-Saharan Africa Sub-Saharan Africa (excluding high income)Sub-Saharan Africa (IDA & IBRD countries)SudanSurinameSwazilandSwedenSwitzerlandSyrian Arab RepublicTajikistanTanzaniaThailandTimor-LesteTogoTongaTrinidad and TobagoTunisiaTurkeyTurkmenistanTurks and Caicos IslandsUgandaUkraineUnited Arab EmiratesUnited KingdomUnited StatesUpper middle incomeUruguayVanuatuVenezuela, RBVietnamVirgin Islands (U.S.)WorldYemen, Rep.ZambiaZimbabwe Timeline:
This timeline shows a graph from 1965 to 2016 of Malaysia. No data until 1964. Number of actual observations by date: 52.
Source name:
World Development Indicators
Source organization:
World Bank staff estimates from the Comtrade database maintained by the United Nations Statistics Division.
Categories, topics:
Energy & Mining, Private Sector, Trade
Last updated:
apr 23, 2017
Indicators value changes by year
Maximum:
28.856
jan 1, 1966
At the date of observation
Value
Absolute change
Change from previous value
jan 1, 1965
27.881
+27.881
0.0%
jan 1, 1966
28.856
+0.975
3.5%
jan 1, 1967
25.925
-2.931
-10.16%
jan 1, 1968
26.532
+0.607
2.34%
jan 1, 1969
23.712
-2.82
-10.63%
jan 1, 1970
21.76
-1.952
-8.23%
jan 1, 1971
22.57
+0.811
3.73%
jan 1, 1972
19.262
-3.308
-14.66%
jan 1, 1973
20.219
+0.957
4.97%
jan 1, 1974
13.026
-7.193
-35.58%
jan 1, 1975
15.539
+2.513
19.29%
jan 1, 1976
13.861
-1.678
-10.8%
jan 1, 1977
12.4
-1.461
-10.54%
jan 1, 1978
12.42
+0.02
0.16%
jan 1, 1979
12.78
+0.36
2.9%
jan 1, 1980
10.666
-2.114
-16.54%
jan 1, 1981
10.19
-0.476
-4.46%
jan 1, 1982
9.018
-1.172
-11.5%
jan 1, 1983
6.248
-2.77
-30.71%
jan 1, 1984
6.347
+0.098
1.58%
jan 1, 1985
3.995
-2.352
-37.06%
jan 1, 1986
5.318
+1.324
33.14%
jan 1, 1987
2.968
-2.35
-44.19%
jan 1, 1988
3.055
+0.087
2.93%
jan 1, 1989
2.997
-0.058
-1.91%
jan 1, 1990
3.003
+0.006
0.19%
jan 1, 1991
2.077
-0.925
-30.82%
jan 1, 1992
1.534
-0.543
-26.16%
jan 1, 1993
1.536
+0.002
0.16%
jan 1, 1994
1.237
-0.299
-19.46%
jan 1, 1995
1.27
+0.033
2.65%
jan 1, 1996
1.347
+0.077
6.05%
jan 1, 1997
1.226
-0.121
-9.02%
jan 1, 1998
1.215
-0.011
-0.9%
jan 1, 1999
1.2
-0.015
-1.22%
jan 1, 2000
1.152
-0.047
-3.94%
jan 1, 2001
1.044
-0.108
-9.38%
jan 1, 2002
1.025
-0.019
-1.84%
jan 1, 2003
0.919
-0.106
-10.32%
jan 1, 2004
0.874
-0.045
-4.9%
jan 1, 2005
1.109
+0.234
26.8%
jan 1, 2006
1.133
+0.024
2.17%
jan 1, 2007
1.346
+0.214
18.86%
jan 1, 2008
1.608
+0.262
19.47%
jan 1, 2009
1.798
+0.19
11.81%
jan 1, 2010
1.546
-0.253
-14.04%
jan 1, 2011
1.956
+0.41
26.52%
jan 1, 2012
2.492
+0.537
27.44%
jan 1, 2013
2.334
-0.158
-6.35%
jan 1, 2014
3.302
+0.968
41.45%
jan 1, 2015
2.888
-0.414
-12.53%
jan 1, 2016
3.938
+1.05
36.35%
Ranking of countries by current statistics by years


Comments: