29
/
en
AIzaSyAYiBZKx7MnpbEhh9jyipgxe19OcubqV5w
April 1, 2024
126630
El Salvador
SLV
true
2
1
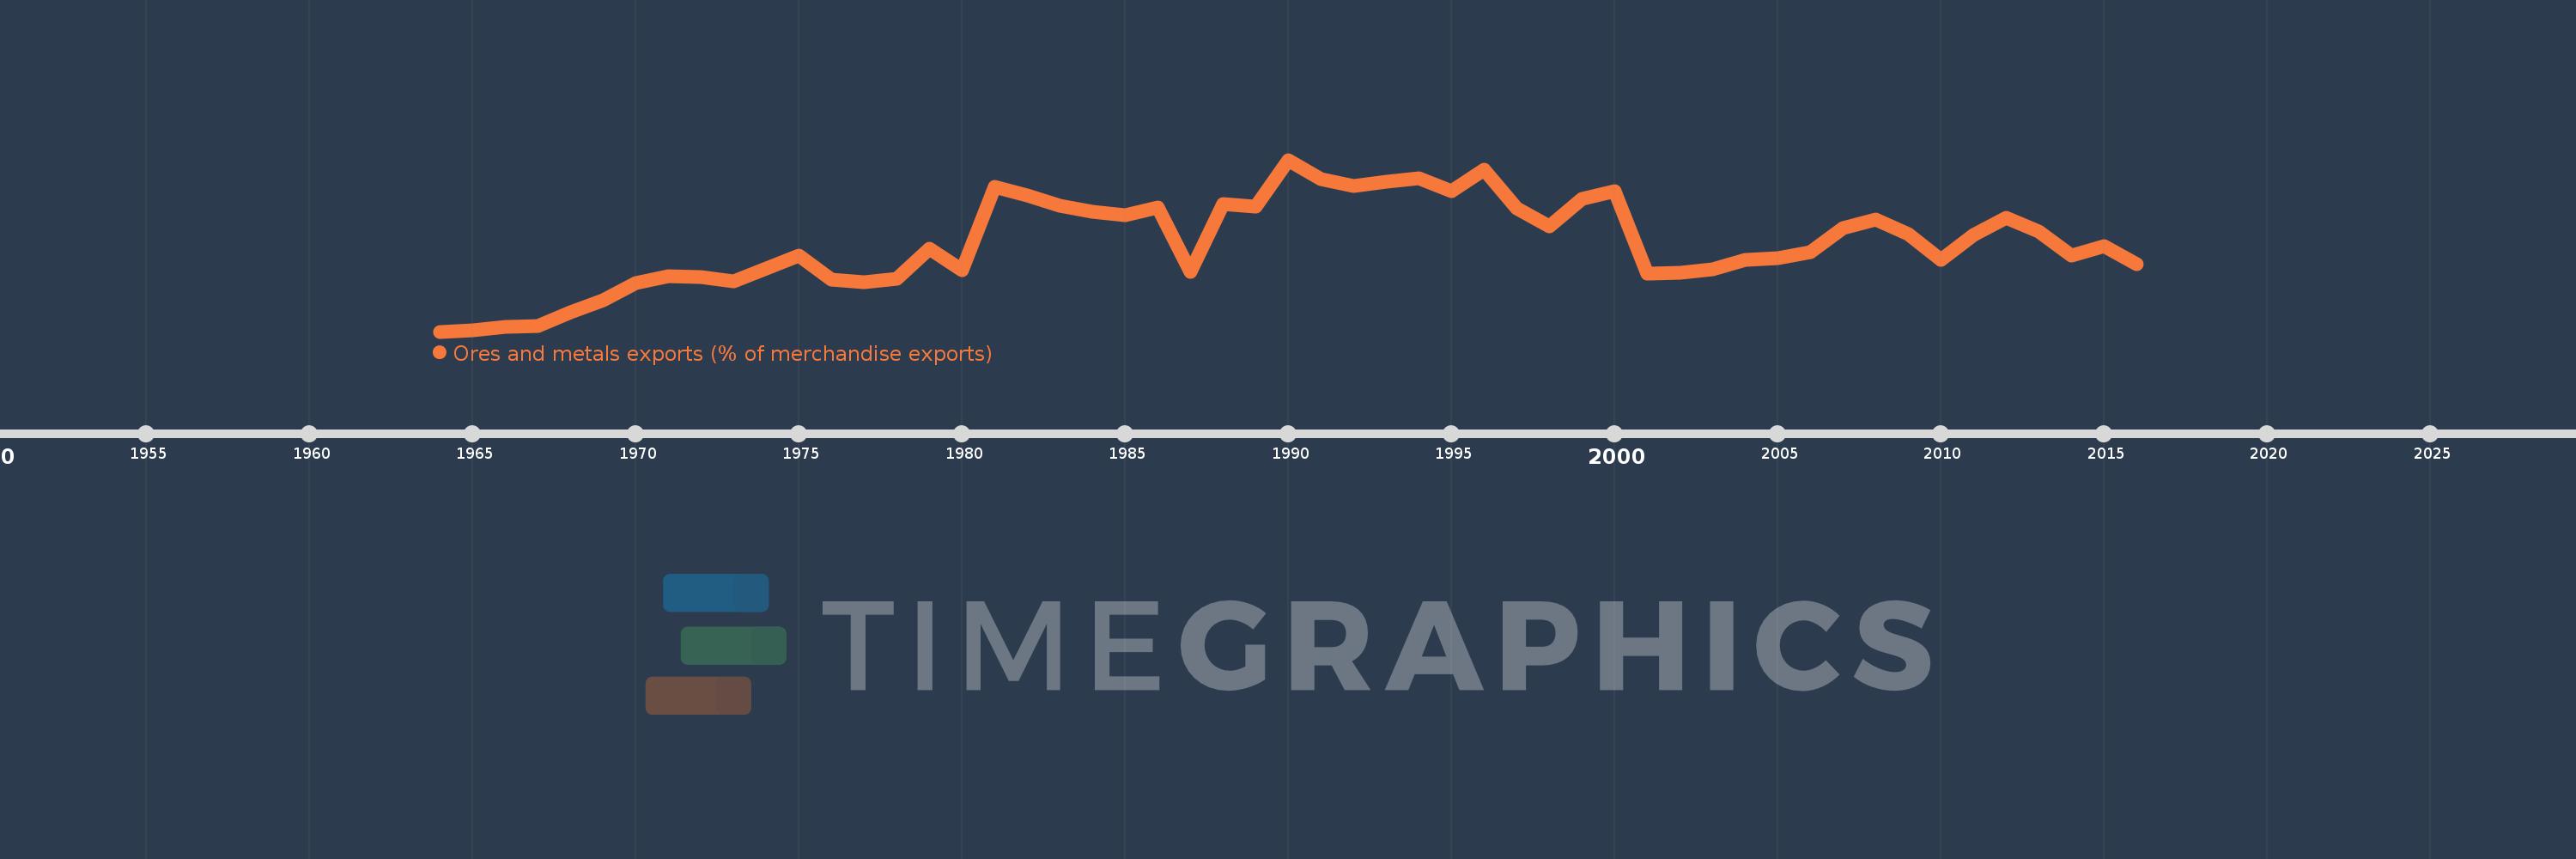
Ores and metals exports (% of merchandise exports)
2016,2015,2014,2013,2012,2011,2010,2009,2008,2007,2006,2005,2004,2003,2002,2001,2000,1999,1998,1997,1996,1995,1994,1993,1992,1991,1990,1989,1988,1987,1986,1985,1984,1983,1982,1981,1980,1979,1978,1977,1976,1975,1974,1973,1972,1971,1970,1969,1968,1967,1966,1965,1964
This statistics in other country:
AfghanistanAlbaniaAlgeriaAndorraAngolaAntigua and BarbudaArab WorldArgentinaArmeniaArubaAustraliaAustriaAzerbaijanBahamas, TheBahrainBangladeshBarbadosBelarusBelgiumBelizeBeninBermudaBhutanBoliviaBosnia and HerzegovinaBotswanaBrazilBrunei DarussalamBulgariaBurkina FasoBurundiCabo VerdeCambodiaCameroonCanadaCaribbean small statesCayman IslandsCentral African RepublicCentral Europe and the BalticsChadChileChinaColombiaComorosCongo, Dem. Rep.Congo, Rep.Costa RicaCote d'IvoireCroatiaCubaCyprusCzech RepublicDenmarkDjiboutiDominicaDominican RepublicEarly-demographic dividendEast Asia & PacificEast Asia & Pacific (excluding high income)East Asia & Pacific (IDA & IBRD countries)EcuadorEgypt, Arab Rep.El SalvadorEquatorial GuineaEritreaEstoniaEthiopiaEuro areaEurope & Central AsiaEurope & Central Asia (excluding high income)Europe & Central Asia (IDA & IBRD countries)European UnionFaroe IslandsFijiFinlandFragile and conflict affected situationsFranceFrench PolynesiaGabonGambia, TheGeorgiaGermanyGhanaGreeceGreenlandGrenadaGuatemalaGuineaGuinea-BissauGuyanaHaitiHeavily indebted poor countries (HIPC)High incomeHondurasHong Kong SAR, ChinaHungaryIBRD onlyIcelandIDA & IBRD totalIDA blendIDA onlyIDA totalIndiaIndonesiaIran, Islamic Rep.IraqIrelandIsraelItalyJamaicaJapanJordanKazakhstanKenyaKiribatiKorea, Rep.KuwaitKyrgyz RepublicLao PDRLate-demographic dividendLatin America & Caribbean Latin America & Caribbean (excluding high income)Latin America & the Caribbean (IDA & IBRD countries)LatviaLeast developed countries: UN classificationLebanonLesothoLiberiaLibyaLithuaniaLow & middle incomeLower middle incomeLuxembourgMacao SAR, ChinaMacedonia, FYRMadagascarMalawiMalaysiaMaldivesMaliMaltaMauritaniaMauritiusMexicoMiddle East & North AfricaMiddle East & North Africa (excluding high income)Middle East & North Africa (IDA & IBRD countries)Middle incomeMoldovaMongoliaMoroccoMozambiqueMyanmarNamibiaNepalNetherlandsNew CaledoniaNew ZealandNicaraguaNigerNigeriaNorth AmericaNorwayOECD membersOmanOther small statesPacific island small statesPakistanPalauPanamaPapua New GuineaParaguayPeruPhilippinesPolandPortugalPost-demographic dividendPre-demographic dividendQatarRomaniaRussian FederationRwandaSamoaSao Tome and PrincipeSaudi ArabiaSenegalSerbiaSeychellesSierra LeoneSingaporeSlovak RepublicSloveniaSmall statesSolomon IslandsSomaliaSouth AfricaSouth AsiaSouth Asia (IDA & IBRD)SpainSri LankaSt. Kitts and NevisSt. LuciaSt. Vincent and the GrenadinesSub-Saharan Africa Sub-Saharan Africa (excluding high income)Sub-Saharan Africa (IDA & IBRD countries)SudanSurinameSwazilandSwedenSwitzerlandSyrian Arab RepublicTajikistanTanzaniaThailandTimor-LesteTogoTongaTrinidad and TobagoTunisiaTurkeyTurkmenistanTurks and Caicos IslandsUgandaUkraineUnited Arab EmiratesUnited KingdomUnited StatesUpper middle incomeUruguayVanuatuVenezuela, RBVietnamVirgin Islands (U.S.)WorldYemen, Rep.ZambiaZimbabwe Timeline:
This timeline shows a graph from 1964 to 2016 of El Salvador. No data until 1963. Number of actual observations by date: 53.
Source name:
World Development Indicators
Source organization:
World Bank staff estimates from the Comtrade database maintained by the United Nations Statistics Division.
Categories, topics:
Energy & Mining, Private Sector, Trade
Last updated:
apr 23, 2017
Indicators value changes by year
At the date of observation
Value
Absolute change
Change from previous value
jan 1, 1964
0.08
+0.08
0.0%
jan 1, 1965
0.1
+0.02
25.3%
jan 1, 1966
0.163
+0.063
62.43%
jan 1, 1967
0.169
+0.006
3.85%
jan 1, 1968
0.415
+0.246
145.12%
jan 1, 1969
0.622
+0.207
49.78%
jan 1, 1970
0.919
+0.297
47.77%
jan 1, 1971
1.034
+0.115
12.53%
jan 1, 1972
1.024
-0.009
-0.89%
jan 1, 1973
0.942
-0.083
-8.06%
jan 1, 1974
1.17
+0.228
24.26%
jan 1, 1975
1.383
+0.213
18.17%
jan 1, 1976
0.977
-0.406
-29.39%
jan 1, 1977
0.927
-0.05
-5.11%
jan 1, 1978
0.984
+0.057
6.16%
jan 1, 1979
1.502
+0.518
52.66%
jan 1, 1980
1.13
-0.372
-24.76%
jan 1, 1981
2.564
+1.434
126.89%
jan 1, 1982
2.421
-0.143
-5.56%
jan 1, 1983
2.244
-0.178
-7.34%
jan 1, 1984
2.134
-0.109
-4.87%
jan 1, 1985
2.081
-0.054
-2.51%
jan 1, 1986
2.216
+0.135
6.49%
jan 1, 1987
1.111
-1.105
-49.87%
jan 1, 1988
2.279
+1.169
105.24%
jan 1, 1989
2.223
-0.057
-2.48%
jan 1, 1990
3.032
+0.809
36.41%
jan 1, 1991
2.706
-0.326
-10.75%
jan 1, 1992
2.577
-0.13
-4.79%
jan 1, 1993
2.657
+0.081
3.12%
jan 1, 1994
2.719
+0.062
2.33%
jan 1, 1995
2.489
-0.23
-8.46%
jan 1, 1996
2.86
+0.371
14.93%
jan 1, 1997
2.195
-0.665
-23.25%
jan 1, 1998
1.888
-0.308
-14.01%
jan 1, 1999
2.354
+0.466
24.7%
jan 1, 2000
2.499
+0.145
6.15%
jan 1, 2001
1.072
-1.427
-57.1%
jan 1, 2002
1.092
+0.02
1.85%
jan 1, 2003
1.156
+0.064
5.86%
jan 1, 2004
1.315
+0.159
13.8%
jan 1, 2005
1.347
+0.032
2.41%
jan 1, 2006
1.45
+0.103
7.63%
jan 1, 2007
1.862
+0.412
28.4%
jan 1, 2008
2.01
+0.149
7.99%
jan 1, 2009
1.752
-0.259
-12.87%
jan 1, 2010
1.318
-0.434
-24.76%
jan 1, 2011
1.745
+0.427
32.39%
jan 1, 2012
2.042
+0.298
17.07%
jan 1, 2013
1.797
-0.245
-12.0%
jan 1, 2014
1.382
-0.415
-23.1%
jan 1, 2015
1.55
+0.168
12.13%
jan 1, 2016
1.241
-0.309
-19.91%
Ranking of countries by current statistics by years


Comments: