29
/
en
AIzaSyAYiBZKx7MnpbEhh9jyipgxe19OcubqV5w
April 1, 2024
52917
OECD members
OED
false
2
1
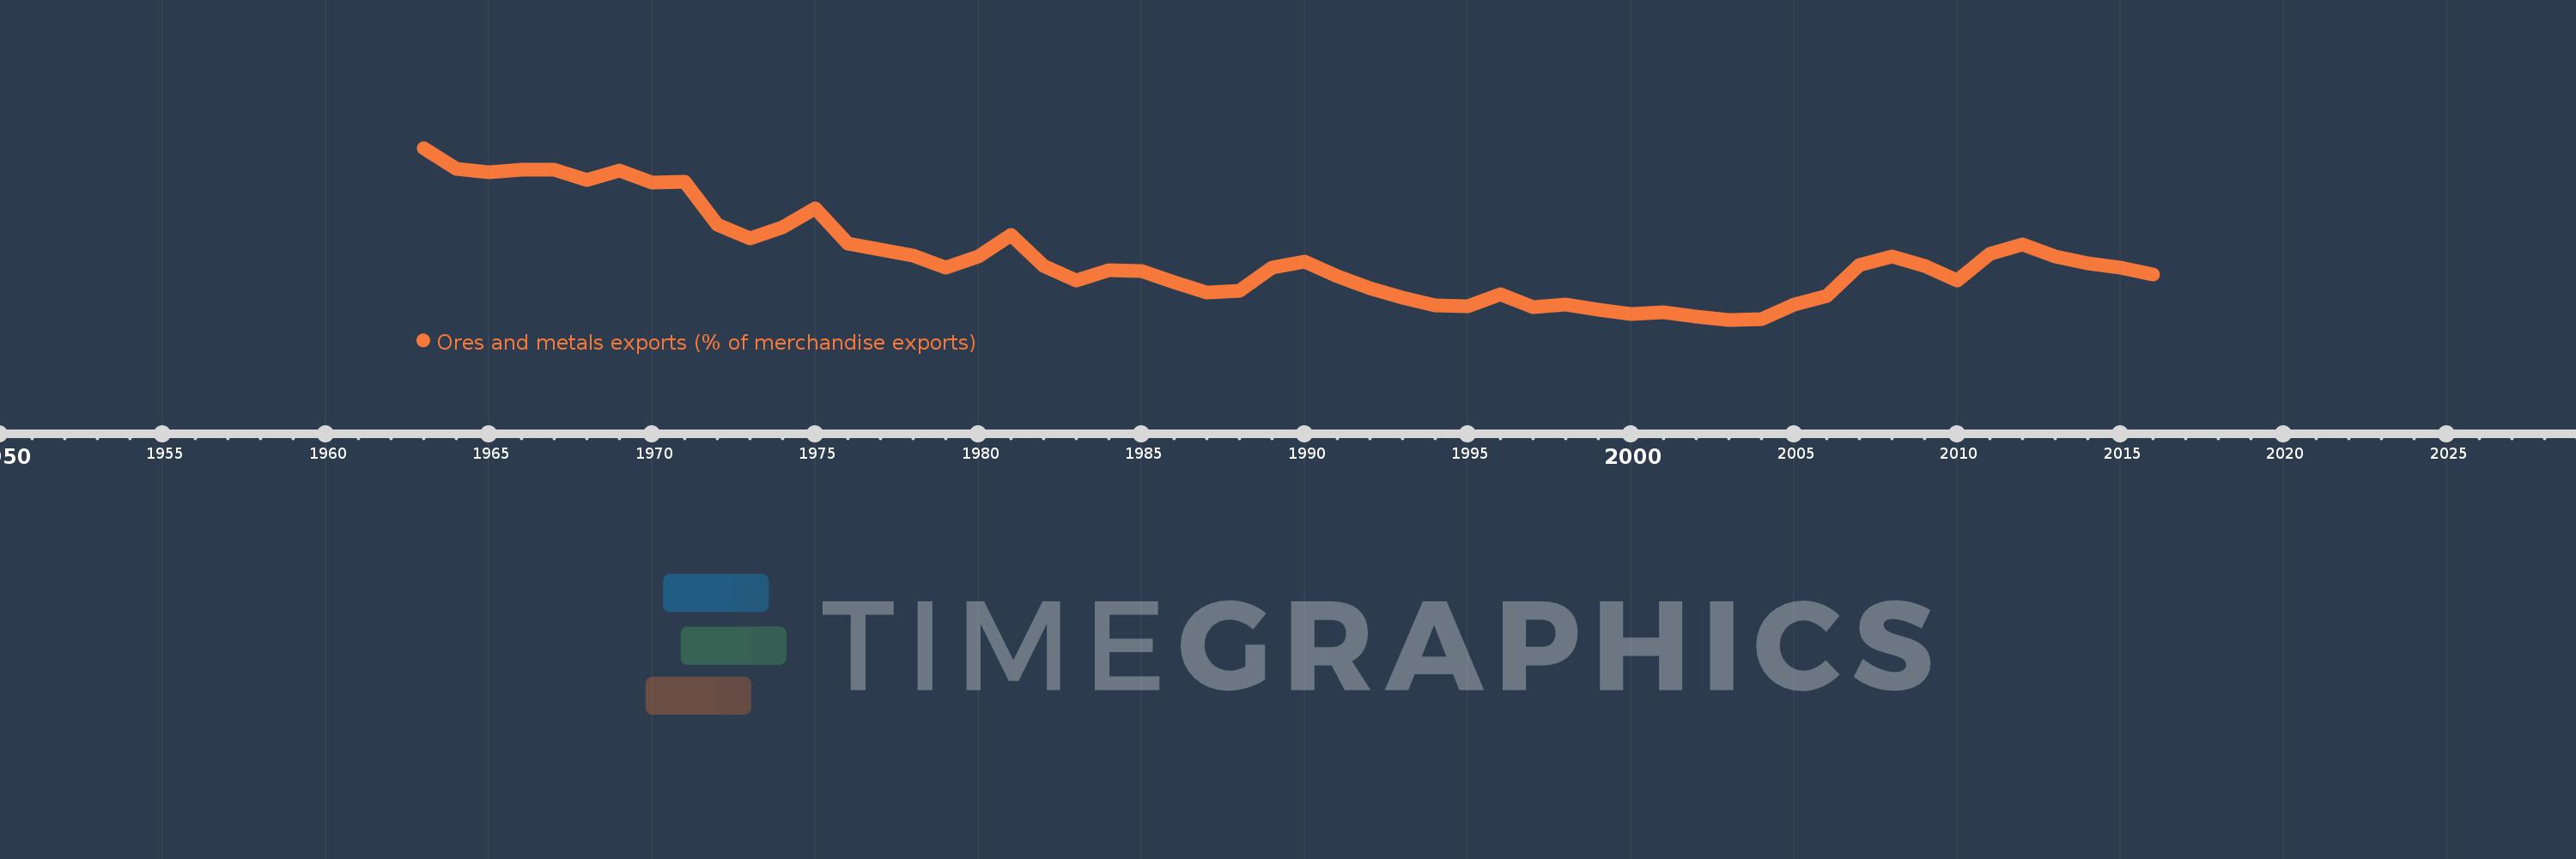
Ores and metals exports (% of merchandise exports)
2016,2015,2014,2013,2012,2011,2010,2009,2008,2007,2006,2005,2004,2003,2002,2001,2000,1999,1998,1997,1996,1995,1994,1993,1992,1991,1990,1989,1988,1987,1986,1985,1984,1983,1982,1981,1980,1979,1978,1977,1976,1975,1974,1973,1972,1971,1970,1969,1968,1967,1966,1965,1964,1963
This statistics in other country:
AfghanistanAlbaniaAlgeriaAndorraAngolaAntigua and BarbudaArab WorldArgentinaArmeniaArubaAustraliaAustriaAzerbaijanBahamas, TheBahrainBangladeshBarbadosBelarusBelgiumBelizeBeninBermudaBhutanBoliviaBosnia and HerzegovinaBotswanaBrazilBrunei DarussalamBulgariaBurkina FasoBurundiCabo VerdeCambodiaCameroonCanadaCaribbean small statesCayman IslandsCentral African RepublicCentral Europe and the BalticsChadChileChinaColombiaComorosCongo, Dem. Rep.Congo, Rep.Costa RicaCote d'IvoireCroatiaCubaCyprusCzech RepublicDenmarkDjiboutiDominicaDominican RepublicEarly-demographic dividendEast Asia & PacificEast Asia & Pacific (excluding high income)East Asia & Pacific (IDA & IBRD countries)EcuadorEgypt, Arab Rep.El SalvadorEquatorial GuineaEritreaEstoniaEthiopiaEuro areaEurope & Central AsiaEurope & Central Asia (excluding high income)Europe & Central Asia (IDA & IBRD countries)European UnionFaroe IslandsFijiFinlandFragile and conflict affected situationsFranceFrench PolynesiaGabonGambia, TheGeorgiaGermanyGhanaGreeceGreenlandGrenadaGuatemalaGuineaGuinea-BissauGuyanaHaitiHeavily indebted poor countries (HIPC)High incomeHondurasHong Kong SAR, ChinaHungaryIBRD onlyIcelandIDA & IBRD totalIDA blendIDA onlyIDA totalIndiaIndonesiaIran, Islamic Rep.IraqIrelandIsraelItalyJamaicaJapanJordanKazakhstanKenyaKiribatiKorea, Rep.KuwaitKyrgyz RepublicLao PDRLate-demographic dividendLatin America & Caribbean Latin America & Caribbean (excluding high income)Latin America & the Caribbean (IDA & IBRD countries)LatviaLeast developed countries: UN classificationLebanonLesothoLiberiaLibyaLithuaniaLow & middle incomeLower middle incomeLuxembourgMacao SAR, ChinaMacedonia, FYRMadagascarMalawiMalaysiaMaldivesMaliMaltaMauritaniaMauritiusMexicoMiddle East & North AfricaMiddle East & North Africa (excluding high income)Middle East & North Africa (IDA & IBRD countries)Middle incomeMoldovaMongoliaMoroccoMozambiqueMyanmarNamibiaNepalNetherlandsNew CaledoniaNew ZealandNicaraguaNigerNigeriaNorth AmericaNorwayOECD membersOmanOther small statesPacific island small statesPakistanPalauPanamaPapua New GuineaParaguayPeruPhilippinesPolandPortugalPost-demographic dividendPre-demographic dividendQatarRomaniaRussian FederationRwandaSamoaSao Tome and PrincipeSaudi ArabiaSenegalSerbiaSeychellesSierra LeoneSingaporeSlovak RepublicSloveniaSmall statesSolomon IslandsSomaliaSouth AfricaSouth AsiaSouth Asia (IDA & IBRD)SpainSri LankaSt. Kitts and NevisSt. LuciaSt. Vincent and the GrenadinesSub-Saharan Africa Sub-Saharan Africa (excluding high income)Sub-Saharan Africa (IDA & IBRD countries)SudanSurinameSwazilandSwedenSwitzerlandSyrian Arab RepublicTajikistanTanzaniaThailandTimor-LesteTogoTongaTrinidad and TobagoTunisiaTurkeyTurkmenistanTurks and Caicos IslandsUgandaUkraineUnited Arab EmiratesUnited KingdomUnited StatesUpper middle incomeUruguayVanuatuVenezuela, RBVietnamVirgin Islands (U.S.)WorldYemen, Rep.ZambiaZimbabwe Timeline:
This timeline shows a graph from 1963 to 2016 of OECD members. No data until 1962. Number of actual observations by date: 54.
Source name:
World Development Indicators
Source organization:
World Bank staff estimates from the Comtrade database maintained by the United Nations Statistics Division.
Categories, topics:
Energy & Mining, Private Sector, Trade
Last updated:
apr 23, 2017
Indicators value changes by year
At the date of observation
Value
Absolute change
Change from previous value
jan 1, 1963
7.705
+7.705
0.0%
jan 1, 1964
7.096
-0.61
-7.91%
jan 1, 1965
7.012
-0.084
-1.18%
jan 1, 1966
7.076
+0.063
0.91%
jan 1, 1967
7.086
+0.01
0.15%
jan 1, 1968
6.781
-0.305
-4.31%
jan 1, 1969
7.06
+0.28
4.13%
jan 1, 1970
6.719
-0.341
-4.83%
jan 1, 1971
6.746
+0.027
0.4%
jan 1, 1972
5.511
-1.235
-18.31%
jan 1, 1973
5.112
-0.398
-7.23%
jan 1, 1974
5.428
+0.316
6.17%
jan 1, 1975
5.981
+0.554
10.2%
jan 1, 1976
4.963
-1.018
-17.03%
jan 1, 1977
4.794
-0.169
-3.4%
jan 1, 1978
4.619
-0.175
-3.65%
jan 1, 1979
4.262
-0.357
-7.72%
jan 1, 1980
4.591
+0.328
7.7%
jan 1, 1981
5.212
+0.622
13.54%
jan 1, 1982
4.317
-0.895
-17.17%
jan 1, 1983
3.9
-0.418
-9.67%
jan 1, 1984
4.193
+0.294
7.53%
jan 1, 1985
4.165
-0.028
-0.67%
jan 1, 1986
3.85
-0.315
-7.57%
jan 1, 1987
3.562
-0.288
-7.47%
jan 1, 1988
3.596
+0.034
0.95%
jan 1, 1989
4.275
+0.679
18.87%
jan 1, 1990
4.457
+0.182
4.25%
jan 1, 1991
4.03
-0.426
-9.57%
jan 1, 1992
3.68
-0.35
-8.69%
jan 1, 1993
3.414
-0.266
-7.23%
jan 1, 1994
3.199
-0.215
-6.3%
jan 1, 1995
3.173
-0.026
-0.82%
jan 1, 1996
3.521
+0.348
10.98%
jan 1, 1997
3.143
-0.378
-10.75%
jan 1, 1998
3.211
+0.069
2.19%
jan 1, 1999
3.068
-0.143
-4.46%
jan 1, 2000
2.939
-0.13
-4.22%
jan 1, 2001
2.993
+0.054
1.85%
jan 1, 2002
2.862
-0.131
-4.38%
jan 1, 2003
2.777
-0.085
-2.97%
jan 1, 2004
2.789
+0.011
0.41%
jan 1, 2005
3.201
+0.413
14.81%
jan 1, 2006
3.454
+0.253
7.9%
jan 1, 2007
4.348
+0.894
25.88%
jan 1, 2008
4.594
+0.246
5.65%
jan 1, 2009
4.324
-0.27
-5.87%
jan 1, 2010
3.898
-0.426
-9.86%
jan 1, 2011
4.656
+0.758
19.45%
jan 1, 2012
4.945
+0.288
6.19%
jan 1, 2013
4.585
-0.36
-7.28%
jan 1, 2014
4.402
-0.183
-3.99%
jan 1, 2015
4.264
-0.138
-3.14%
jan 1, 2016
4.082
-0.181
-4.25%
Ranking of countries by current statistics by years


Comments: